A family tree activity starts with a choice of scope
The scope settles two things that the task sheet should state in plain words, namely whose tree this is and how far it goes. Settle both before anyone draws, because a pupil who has chosen the scope has also chosen what stays private.
Offer every scope in the table to the whole class as equal choices. When an invented family or a family from a book is an ordinary option, no pupil has to explain why they did not draw their own.
| Scope | What the pupil draws | What the task asks for |
|---|---|---|
| An invented family | Three generations of a family the pupil makes up | Made-up names and years |
| A family from a book or a film | The relatives of one character in a story the class knows | Names from the story |
| A family from history | A ruler, a writer or a scientist and their relatives | Published names and dates, with the source |
| The people who look after me | The adults and children in the daily life of the pupil, by role | Roles such as carer or cousin, with no names |
| My own family, as far as I choose | As many relatives as the pupil wants to show | First names or roles, and nothing else |
Genogram Builder
Draw the finished chart on screen
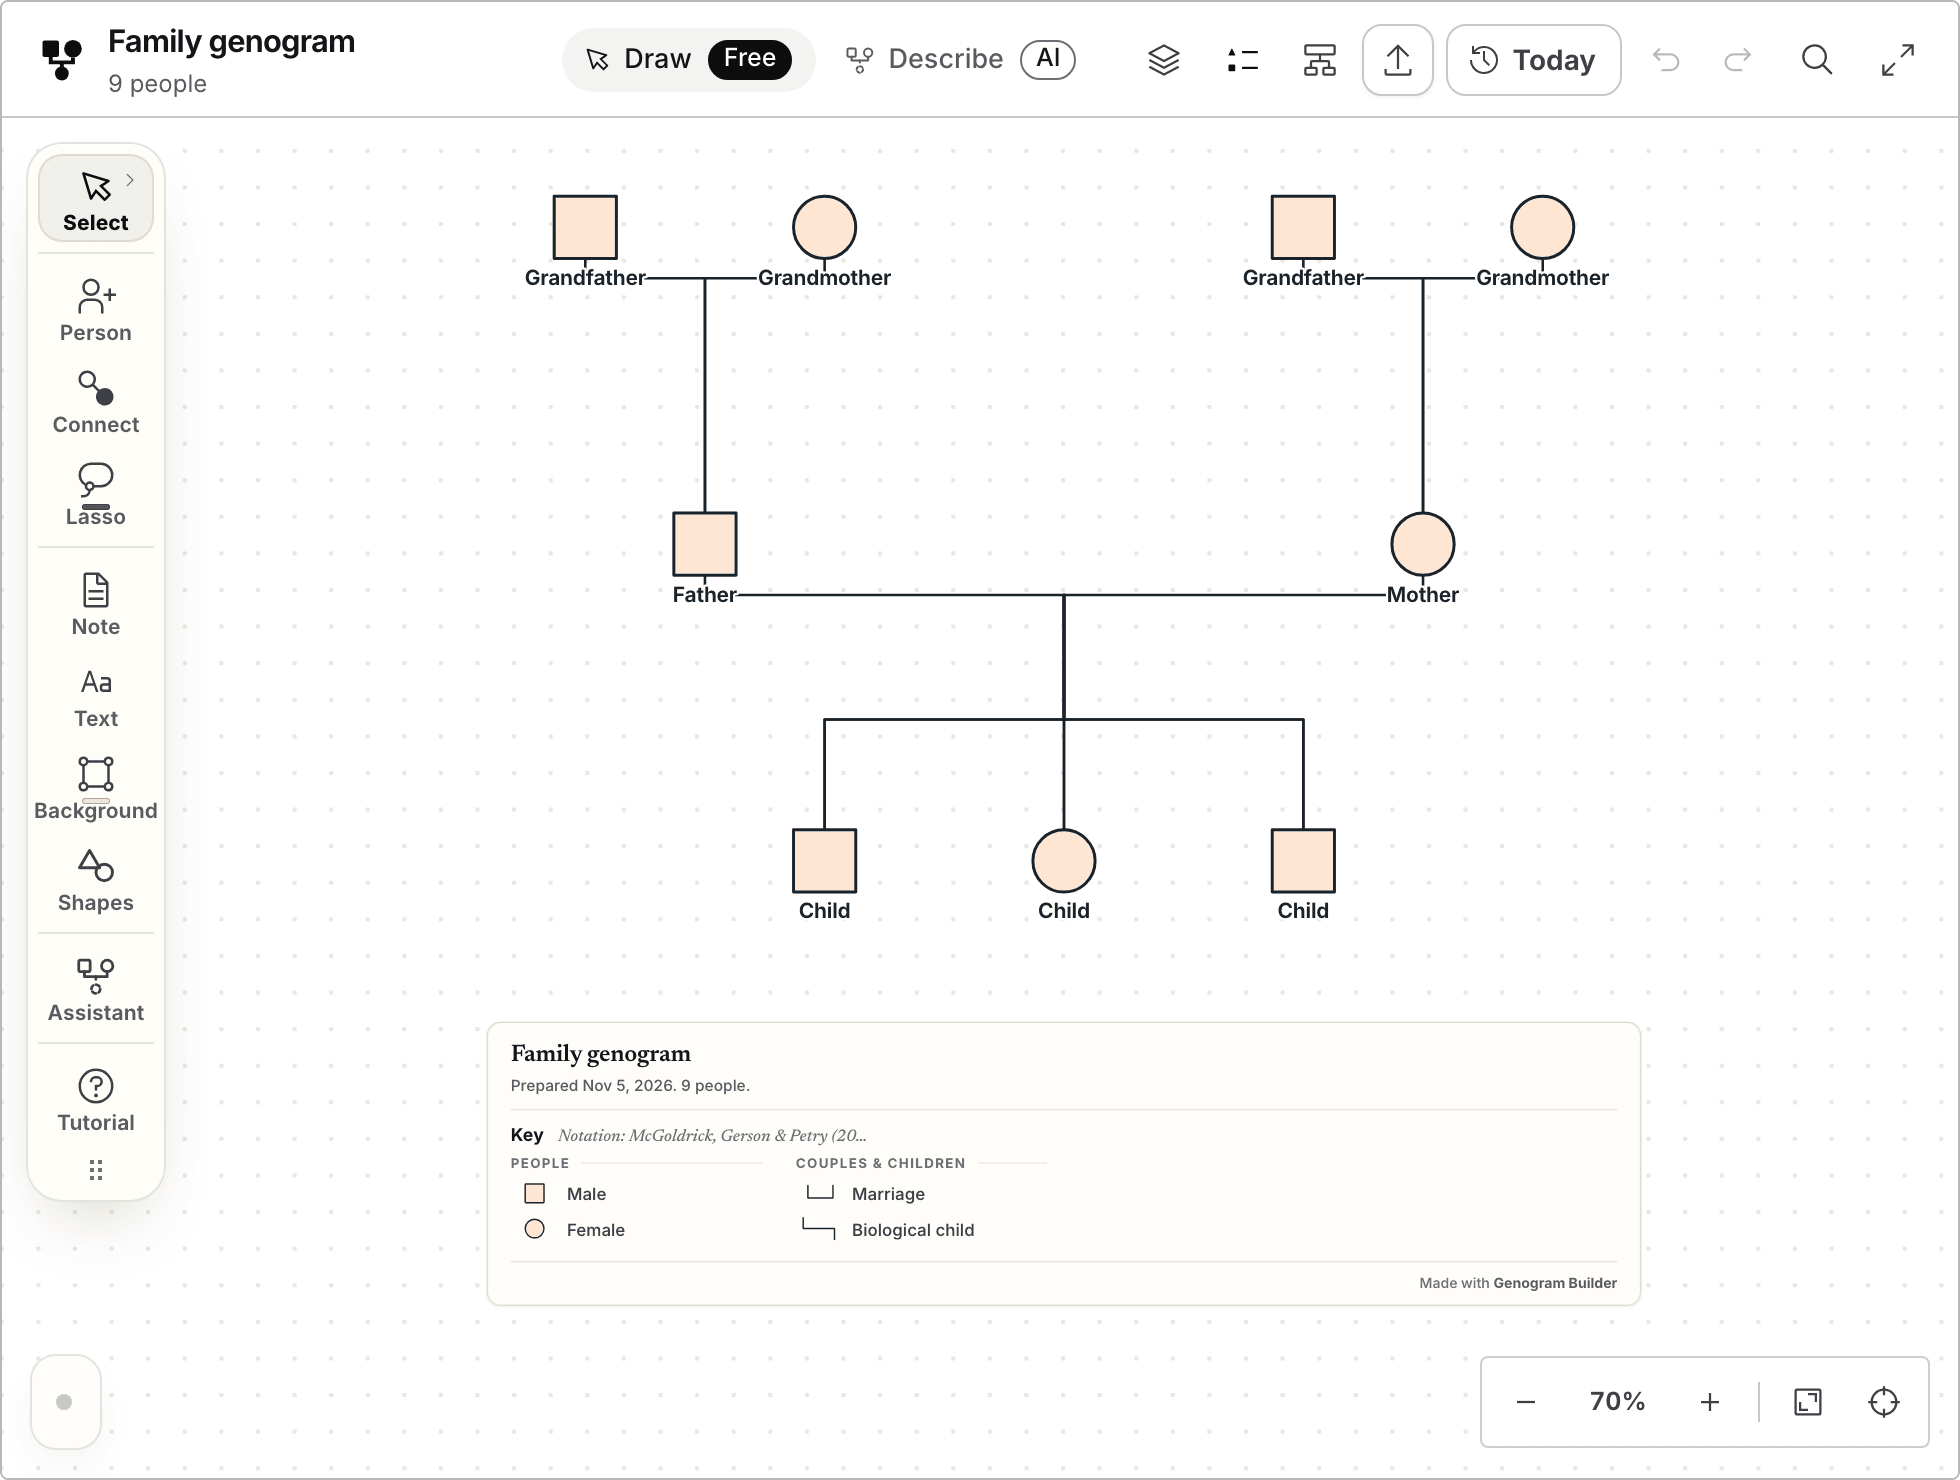
Start from the blank three generation sheet, name each person, then print the chart or export it.
- Opens without an account
- Symbols and joining lines are drawn for you
- PNG and PDF export with a free account, with a watermark
Go from a list of people to a finished chart
The same seven steps work on paper and on screen. A class of nine-year-olds needs two lessons, one for the list and the sketch and one for the fair copy.
- Choose the scope
Pick one row of the table and write it at the top of a rough sheet.
- List the people
Write every person once, with the name or role that will appear on the chart.
- Sort them into generations
Put each person in a row, with the oldest generation at the top and the youngest at the bottom.
- Join the couples
Draw a straight line between two people who are a couple, and write the year under it if the chart uses years.
- Hang the children
Drop a line from the middle of the couple line and branch it to each child, with the oldest on the left.
- Add a title and a key
Name the family, say whether it is invented, and explain any shape or colour the chart uses.
- Check it with a partner
Ask a classmate to read the chart aloud and mark anything they cannot follow.
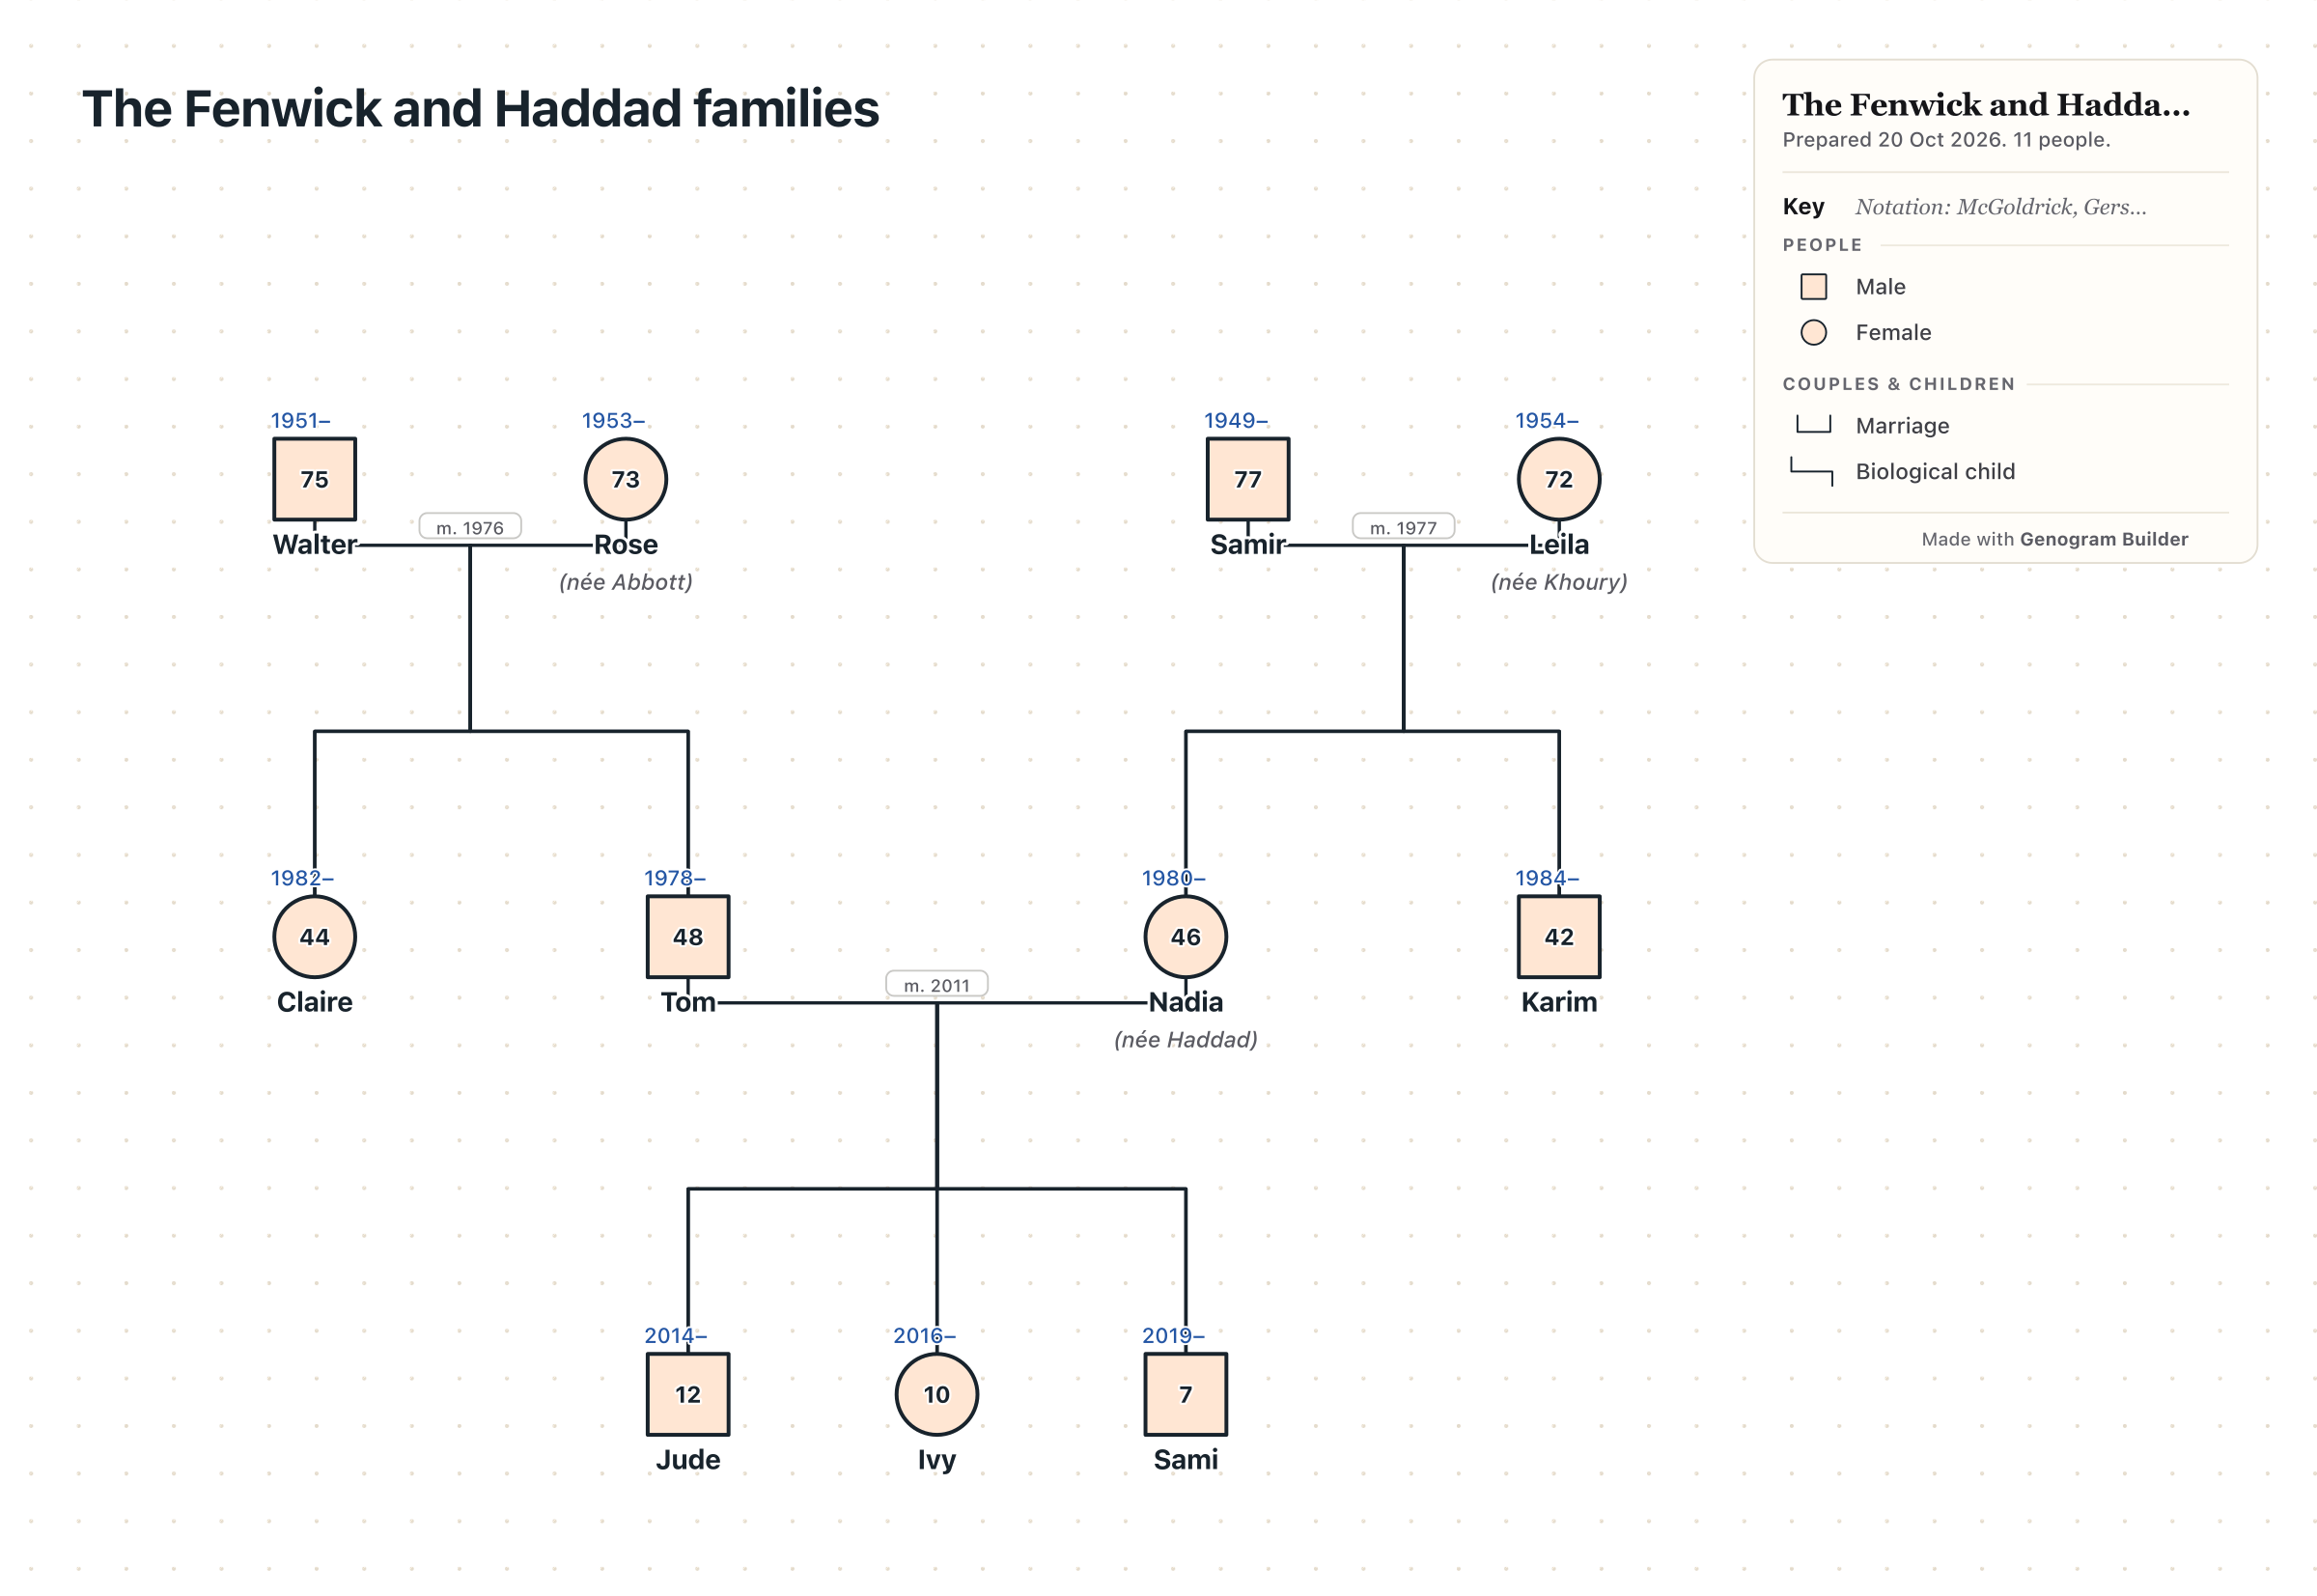
The example chart shows a family that a class invented
The chart at the top of this page shows the Fenwick and Haddad families, which a fictional class invented together as a shared example. The class agreed a rule first, three generations with two sets of grandparents, and then voted on the names.
Walter and Rose Fenwick and Samir and Leila Haddad stand in the top row. Their children fill the middle row, where Tom Fenwick and Nadia Haddad are joined by a marriage line dated 2011. Claire is the sister of Tom and Karim is the brother of Nadia, so Jude, Ivy and Sami in the bottom row have an aunt and an uncle beside their parents.
The editor draws men as squares and women as circles, as a genogram does. A chart drawn by hand can use one shape for everyone, and the page on genogram vs family tree explains the difference.
Offer alternative assignments that keep family details private
Some pupils cannot draw their own family tree, and others would rather not. Adoption, foster care, bereavement, estrangement and migration all leave gaps that a child should not have to explain to a class. The assignments below teach the same skills with no personal content.
| Alternative assignment | What the pupil produces | What it still teaches |
|---|---|---|
| A family tree of a character | A chart of one family from a class novel, with a quotation as evidence for each link | Close reading and drawing generations |
| A historical family tree | A chart of one family from history, with a list of sources | Research, dates and citing sources |
| A family with a rule | An invented family that meets a rule, such as four generations with one pair of twins | The structure of a chart and its lines |
| A map of helpers | The people who help the pupil at school and outside it, by role | Naming relationships without naming relatives |
Write the task so that no pupil has to disclose anything
A family tree project can ask a minor for names, dates of birth, addresses and photographs before anyone has thought about where the finished work will go. None of those details is needed to learn how a tree is drawn. Leave them out of the requirements, and say so on the task sheet.
Lines for the task sheet
- Choose any scope from the list. All of them can earn full marks.
- Use first names, initials, roles or made-up names. Full names are not required.
- Do not include an address, a date of birth or a photograph of a real person.
- You decide who appears on your chart, and you do not have to explain your choice.
- Your chart will be displayed only if you and an adult at home agree.
Checks for the teacher
- The mark scheme rewards the drawing and never the size or shape of a family.
- No pupil is asked to present a personal chart to the class.
- Charts with real names go home with the pupil and are not kept or photographed.
Mark the drawing and never the family
Assess what the pupil controlled. A chart earns its marks when every person appears once, the generations sit in clear rows, couples and children are joined by consistent lines, and the title and key let a stranger read it.
Two parents, four grandparents and a full set of dates are not criteria. A chart of a child and one carer can meet every criterion above.
Finish the chart on paper or on screen
On paper, a pupil rules three rows on a landscape sheet and draws in pencil before inking. The blank three generation sheet is a free PDF with places for four grandparents, two parents and three children, and unused places can be crossed out.
On screen, the same sheet opens in the editor, where a pupil types a name under each symbol.
Common questions
Which age the activity suits
The chart with rows and lines suits pupils from about seven. Younger children do better with a tree of leaves or hands, where the order carries no meaning.
How many generations to ask for
Three is enough to show a couple line, a line of descent and a set of siblings. Ask for three on an invented or historical family, and set no minimum on a personal one.
How to draw half siblings and step-parents
Draw each couple with its own line and hang each child from the couple or the parent they belong to. The guide on half siblings shows the lines.
Draw the class example on screen before the lesson. No account is needed to begin.
Open the blank three generation sheet