Community Genogram Template with People and Resources
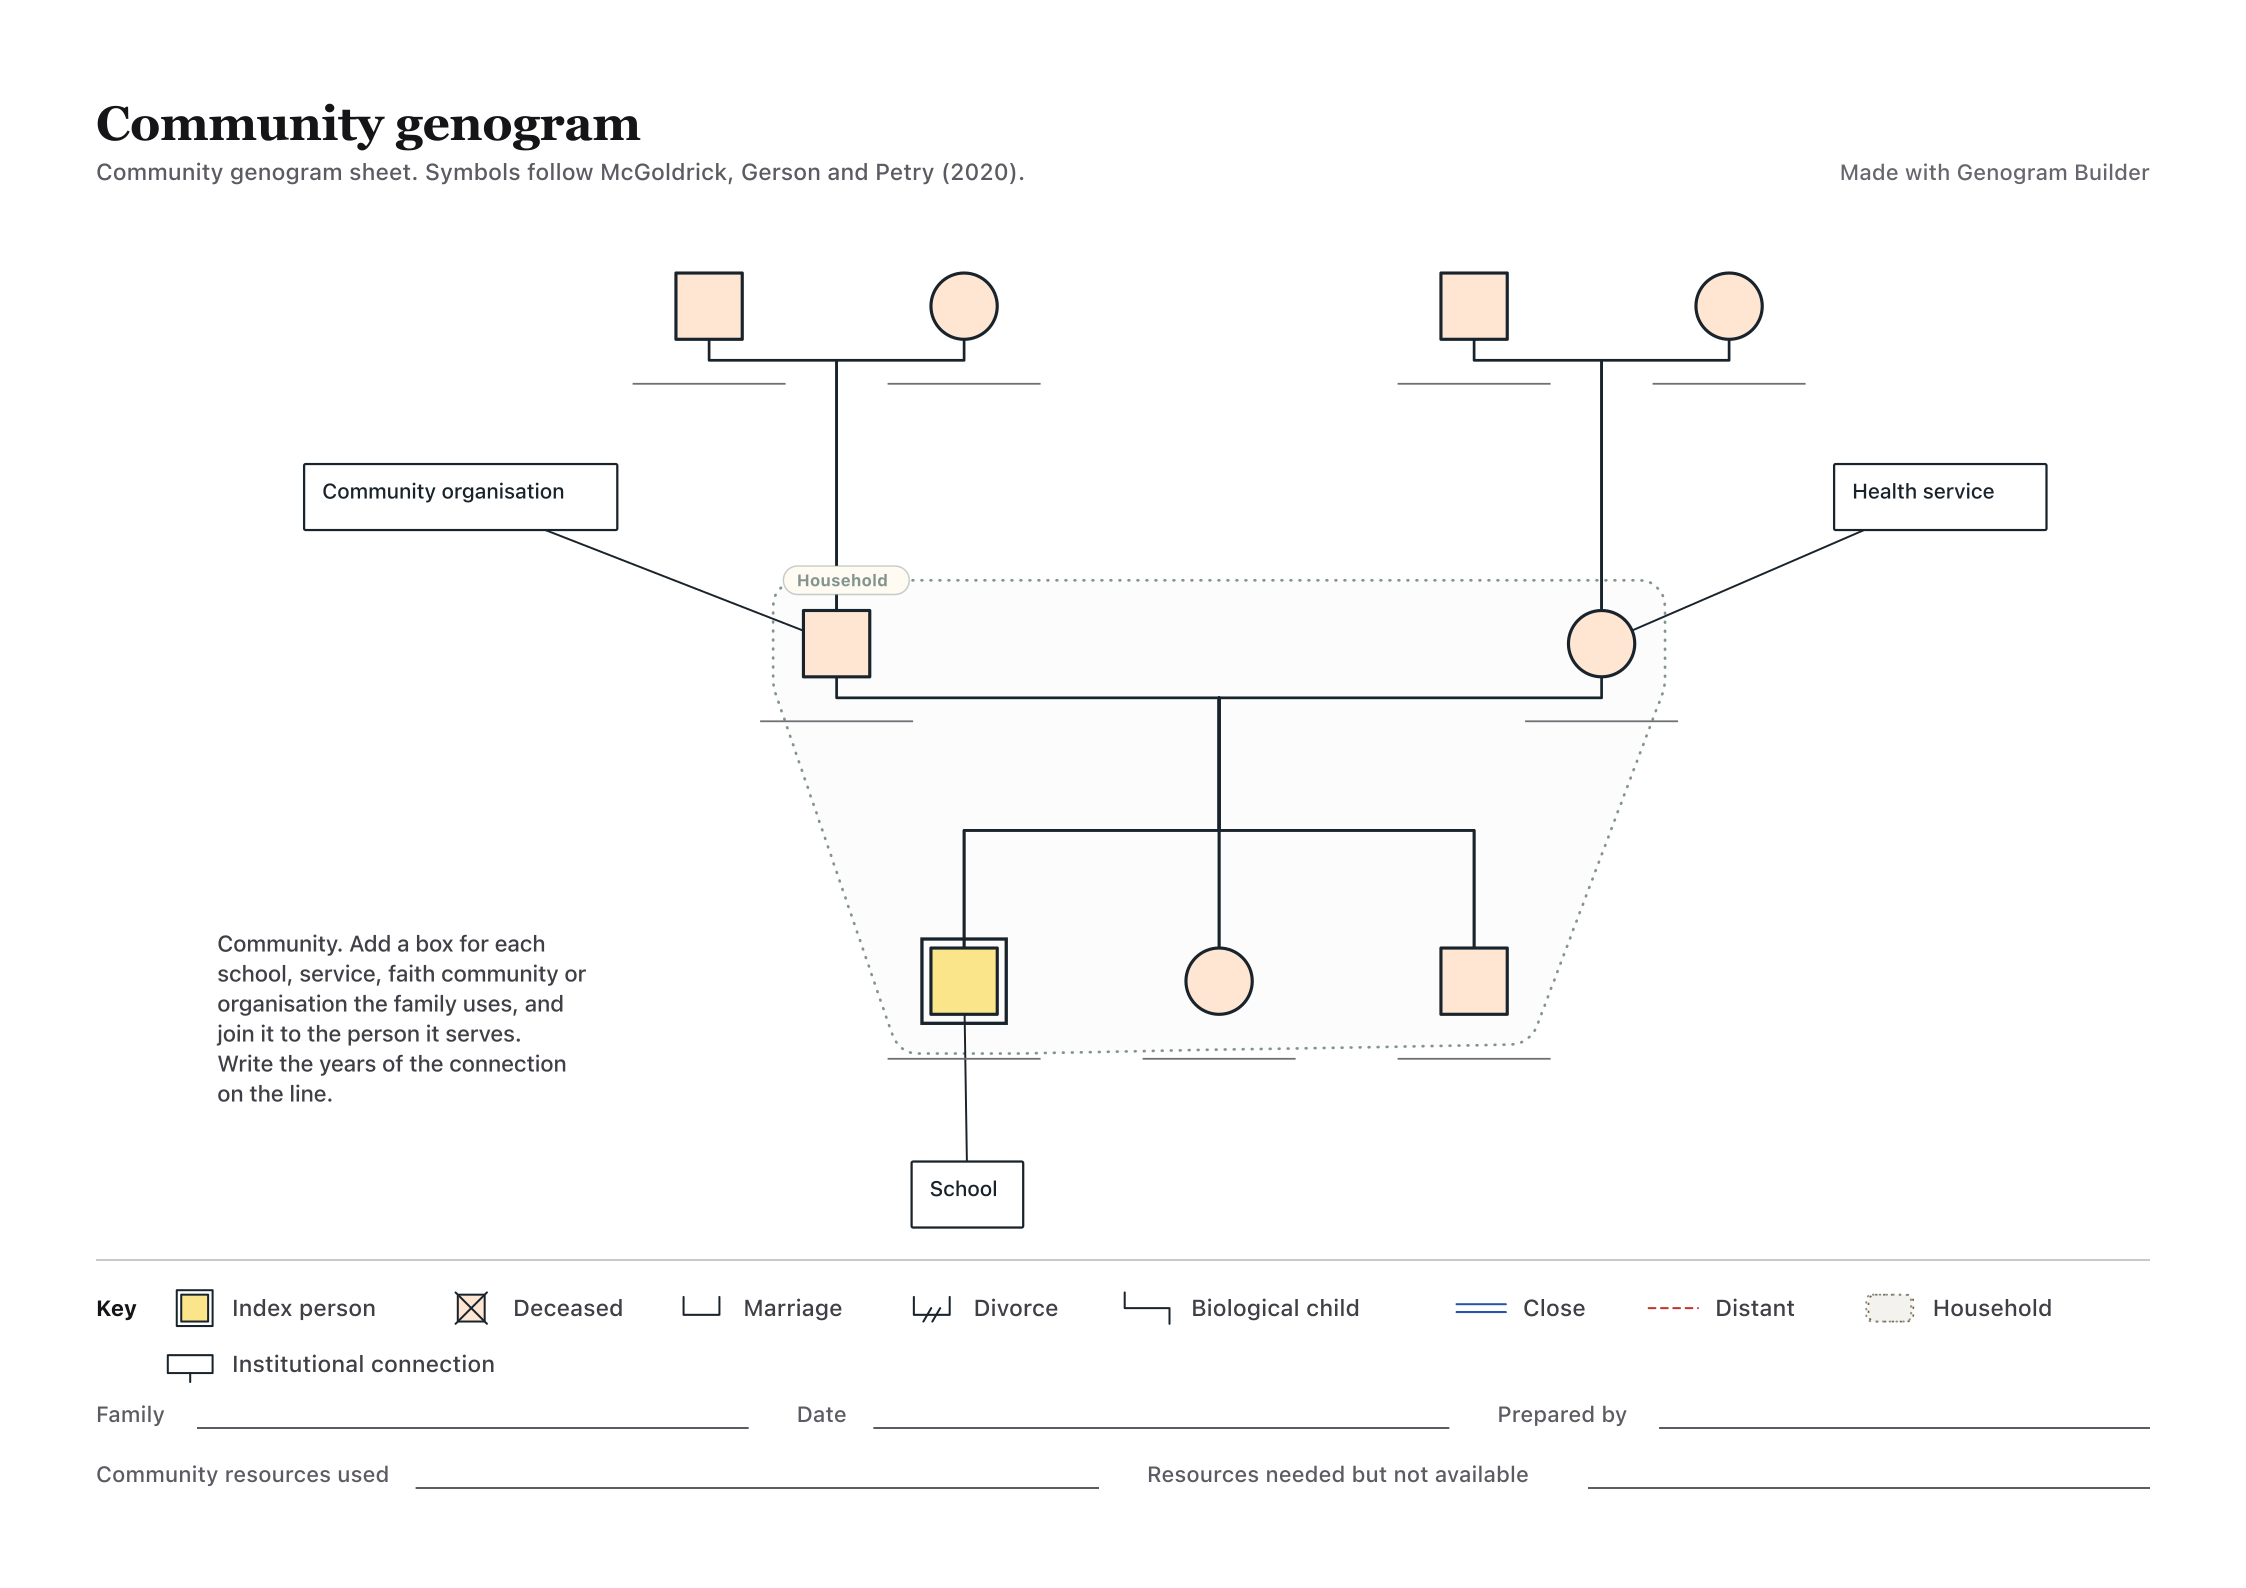
This community genogram template draws a family across three generations with the household outlined and boxes for a school, a health service and a community organisation, each joined to the person it serves. Print the blank A4 sheet, edit it online or open the worked example of a household and its supports.
Blank sheet
Worked example, fictional family
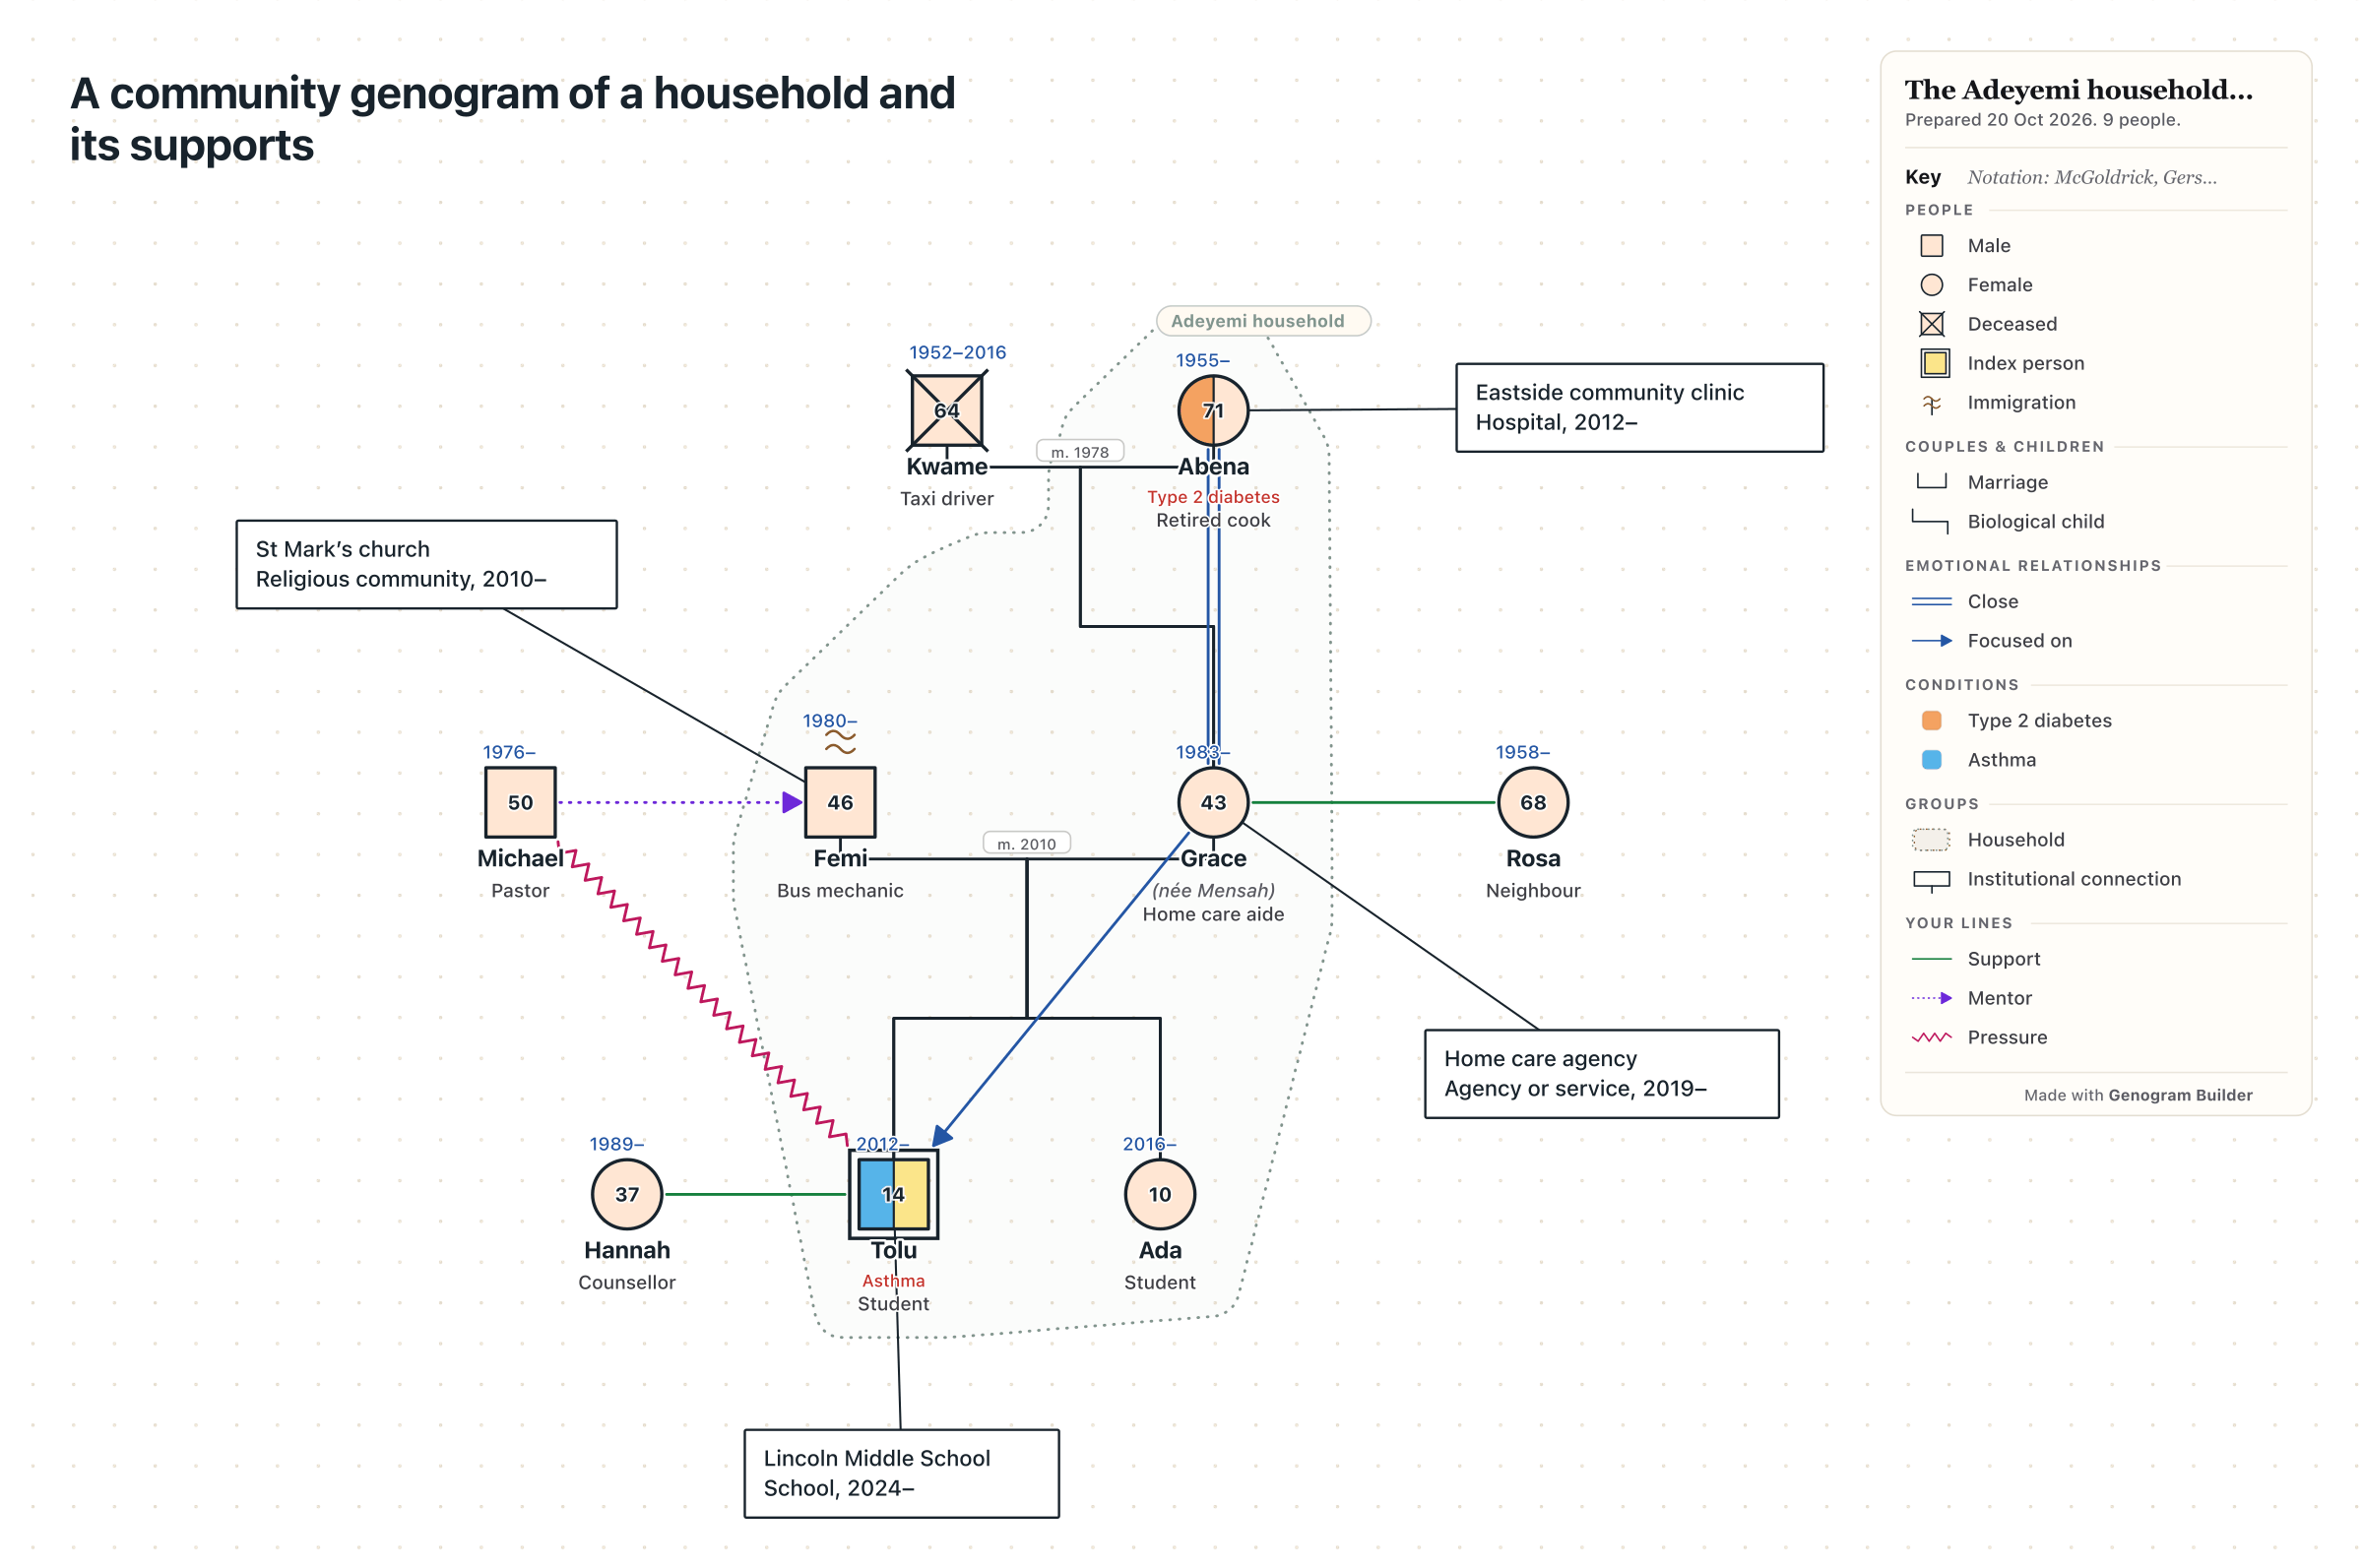
On the left is the blank sheet with three institution boxes. On the right is a worked example for the fictional Adeyemi household, with four institutions, three people from outside the family and the lines between them.
Edit the community genogram template online
Open the blank sheet to replace the placeholders and the three boxes with your own case, or open the worked example and change it. Either one starts a separate chart in this tab and leaves the family saved on the homepage alone.
Select a box to rename the institution, choose its kind, set the years from and until, and join more people to it. The kind and the years are written under its name. Add a person from outside the family with the Person tool, then use Connect to draw a named line of your own, such as Support or Pressure, and the key lists it under your lines.
Edits stay in this tab until you continue in the full editor, which keeps the chart. A visitor can edit without an account but cannot export. A free account exports a PNG, a PDF or a JSON project, with a watermark on the picture and the PDF, and Pro removes the watermark and adds SVG.
A community genogram adds the places and people a family relies on
A community genogram keeps the structure of an ordinary genogram, with the generations, the couples, the children and the household, and adds the community around the family. Schools, clinics, faith communities, agencies and groups are drawn as boxes joined to the people who use them. People outside the family who matter, such as a neighbour or a counsellor, are drawn as people beside it, with lines that say what each relationship gives or costs.
It is drawn in social work, school counselling and health care when the question is about support as well as family history. A reader sees who lives together, who is related to whom and where the help comes from on one page, which a list of services in a case file does not show.
The sheet outlines the household and joins three boxes to it
The drawing has two sets of grandparents, the two parents and three children, with the index person outlined. A dotted outline marks the household around the parents and the children. Three boxes stand around it, a community organisation joined to the father, a health service joined to the mother and a school joined to the index person, and a note says to add a box for each school, service, faith community or organisation the family uses and to write the years on the line.
The key names the index person, the cross for a death, the marriage and divorce lines, the line of a biological child, the close and distant lines, the household and the institutional connection. The fields at the foot take the family, the date, the person who prepared the sheet, the community resources the family uses and the resources it needs but cannot get.
Some connections belong on the genogram and some on an ecomap
An ecomap puts the household in one circle and draws every outside system around it, with lines for strong, weak and stressful connections. It is the better drawing when the question is the strength of many outside ties at once. The community genogram keeps the family structure, so it is the better drawing when it matters which relative uses which service. The genogram and ecomap comparison sets the two side by side.
| Connection | Where to draw it |
|---|---|
| A relative, living or dead | On the genogram, in that person’s generation |
| The people who share a home | On the genogram, inside the household outline |
| A school, clinic, faith community or agency | On the genogram, as a box joined to the person who uses it, with the years |
| A neighbour, counsellor or pastor who matters | On the genogram, as a person beside the family with a named line |
| The strength or stress of every outside tie | On an ecomap, around a circle for the household |
The community genogram example shows a household of five and its supports
The worked example is a fictional household. The index person is Tolu Adeyemi, born in 2012, a student with asthma who was referred to the school counsellor after three absences in a month. He lives with his sister Ada, his father Femi, a bus mechanic who came to the country from Lagos in 2006, his mother Grace, a home care aide who works nights, and his grandmother Abena Mensah, a retired cook with type 2 diabetes. Abena moved in after her husband Kwame died in 2016, so Kwame is drawn outside the household outline.
Three people from outside the family stand beside it. Rosa Delgado, a neighbour, has the children on the nights Abena is at the clinic, and a Support line joins her to Grace. Hannah Price, the counsellor, has seen Tolu every Tuesday since September 2026, and a second Support line joins her to him. Michael Boateng, the pastor, has a Mentor arrow to Femi, who attends his men’s group, and a Pressure line to Tolu, who stopped going to the youth group.
Four institutions are joined to the people who use them, each with its kind and the year the connection began. Lincoln Middle School is joined to Tolu from 2024, the Eastside community clinic to Abena from 2012, St Mark’s church to Femi from 2010 and the home care agency to Grace from 2019. Read together, the agency and the clinic show why the evenings fall to Abena, and to Rosa on the nights Abena is at the clinic.
Fill in the household before the community around it
Write the names and the years from the grandparents down, and redraw the dotted outline around the people who share a home today. Then rename the three boxes and add one for each other institution the family uses, joined to the person it serves, with the years on the line. Add the people from outside the family last, and name each of their lines in the key.
Finish with the two fields at the foot. The resources the family needs but cannot get are often the plan, and writing them beside the resources it already uses keeps the gap in view.
Common questions
The community genogram template is free to print and edit
The blank PDF and PNG download without an account, and both the blank and the worked example can be edited online as a guest. Exporting an edited chart needs a free account, and the free export carries a watermark.
Whether to draw people outside the family
Draw them when they matter to the question, as a neighbour who minds the children or a counsellor who sees the child each week does. Draw them as people, so that their lines can say what the relationship gives or costs.
How to show a service the family has lost
Keep the box and write the years of the connection with an end year, then note the loss in the field for resources needed. In the editor, set the until year on the box.