At a glance
Who each one suits
A genogram is the right diagram when
The question is about the family itself. Who is related to whom, which unions have ended, which relationships are close or hostile, what conditions run through the generations and who lives in one household are all questions a genogram answers in a notation that a reader can check against the key. It is the diagram of pattern over time.
An ecomap is the right diagram when
The question is about the family and the world. Whether a household has a doctor, whether the school is a support or a source of pressure, whether the benefits office, the church and the grandmother across the road are connections of strength or of stress are questions an ecomap answers in one picture. It is the diagram of resources and pressures now.
The same household looks different in each drawing
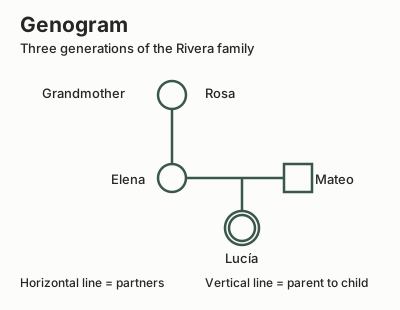
Lucía lives with Elena and Mateo. Rosa, her grandmother, helps with pickup but lives elsewhere. The genogram shows Rosa as Elena’s mother and Lucía’s grandmother. A reader can follow the parent lines across three generations and see that Lucía is the focus person.
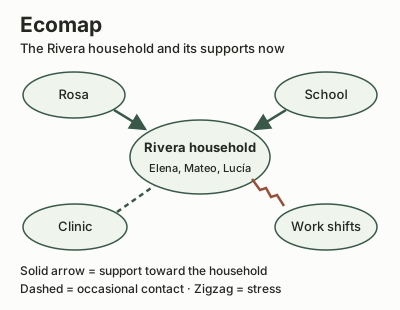
The ecomap puts Lucía’s household in the centre. Rosa and the school are supportive connections, the family has occasional contact with a clinic, and changing work shifts make pickup harder. The key distinguishes support, occasional contact and stress. An arrow points toward the household where support flows in.
Both use lines for the quality of a connection
The two diagrams share one idea, which is that a line can say more than that two things are joined. A genogram can use a double line for closeness, a triple line for fusion or a break to mark cutoff. Check the key for the notation used in a particular drawing. In an ecomap the convention is looser, and the thick, thin, dashed and hatched lines are explained in a legend that the author draws, often with arrows to show the direction of support or demand.
The difference is in what the lines join. A genogram line runs between two people, and the people are nearly always relatives. An ecomap line runs between the household and something outside it, which may be a person, such as a friend or a neighbour, or may be an institution, such as a school, a clinic or a benefits office. A genogram can also join a person to an institution, since the notation provides for it, and that is where the two diagrams meet.
Close
Distant
Hostile
Cutoff
Focused on
Genogram Builder can hold the outside supports on the same chart
To record a few outside supports on a genogram, use household groups, institution connections and notes in Genogram Builder. A household group draws the dashed boundary around the people who live together, so that the household at the centre of an ecomap is visible on the genogram. An institution, which can be a school, a hospital, an agency, a religious community, a support group or a care home, is joined to a person with its own line and the years of the connection. A note beside a person records the quality of a support in a sentence.
People outside the family can also be drawn as ordinary people beside the client, which is what the template below does. A coach, a school counsellor, a best friend and a youth pastor stand beside a teenager and her family, joined to her by the same support, pressure and closeness lines that join the relatives, and the household boundary shows who lives with whom. Use a separate ecomap when you need to see the full network and the direction of support.
A genogram with its supports is drawn in a few steps
Begin with the family. Draw the three generations around the client by hand with the Person and Connect tools, or write them down in a few sentences and let the draft place them, then add the emotional lines and the conditions. Mark the household with a group so that the boundary is visible. Then add the outside world. Each institution is joined to the person it serves with its kind and its dates, and each outside person who matters, a friend, a coach, a neighbour, is drawn beside the family with the line that describes the connection.
When the assignment or the case file asks for a classic ecomap with the household in a circle, draw that on paper or in a whiteboard tool from the same information, and keep the genogram for the family itself. The two then agree, because they were drawn from one set of notes, and the genogram carries the key that lets a reader check every line.
- Draw the family
Three generations around the client, by hand or from a few sentences of notes, with the emotional lines and the conditions.
- Mark the household
Group the people who live together so that the dashed boundary shows on the chart.
- Add the institutions
Join each school, clinic, agency, faith community or support group to the person it serves, with its dates.
- Add the outside people
Draw the friend, the coach or the neighbour beside the family and join them with the line that fits.
Before you decide
Whether an ecomap needs a genogram first
Not strictly, but the two are usually drawn together, and the genogram is the better place to start. It establishes who is in the household and who the relatives are, and the ecomap then shows what surrounds that household. Drawing both from one set of notes keeps them in agreement.
Who draws ecomaps
Social workers, family nurses, care coordinators and students on those courses draw them most, because their work is about resources and pressures around a household as much as about the family itself. Therapists tend to draw genograms and add the supports that matter to the case.
Whether Genogram Builder draws a classic ecomap
Use Genogram Builder for the family diagram and related institutions. For a classic ecomap, draw the household circle and outside network on paper or in a whiteboard tool using the same notes.
What this page leaves out
It describes the two diagrams as they are commonly drawn and the notation as this site draws it. Ecomap conventions vary between textbooks and agencies, and this page does not prefer one over another.
Sources and methodology
We make Genogram Builder. We used the references below for this comparison. Last checked on 4 November 2026.
Draw the family in the genogram editor. For a separate ecomap, start with the household and map its current supports using the example above.
Draw a genogram