How to make a genogram in PowerPoint in seven steps
Learning how to make a genogram in PowerPoint starts with a plan on paper. Write the family as rows, one for each generation with the oldest at the top, and note which children belong to which couple. The commands below are named as Microsoft support names them for PowerPoint on Windows, including PowerPoint for Microsoft 365.
- Draw the first person
On the Insert tab, choose Shapes in the Illustrations group. Pick a rectangle and hold Shift while you drag to draw a square for a man, or an oval with Shift for a circle for a woman.
- Give every person one size
With the shape selected, open the Shape Format tab and type the same value in the Height and Width boxes of the Size group.
- Duplicate the symbol
On Windows, press Ctrl+D or hold Ctrl while you drag, and a copy is made. Set out one copy for each person in rows.
- Add the names
Put each name and year of birth in a text box under its symbol, so the symbol stays clear for the marks of the notation.
- Join each couple with a connector
Choose Shapes again and pick the elbow connector under Lines. Start on a dot on the outline of one partner and end on a dot on the other.
- Hang the children from the couple
Draw a line down from the middle of the couple line, a sibling line across, and a line to each child with the oldest on the left.
- Align and group the family
Select each generation and choose Shape Format, Align, Align Middle. Then select the whole chart and choose Shape Format, Group, Group.
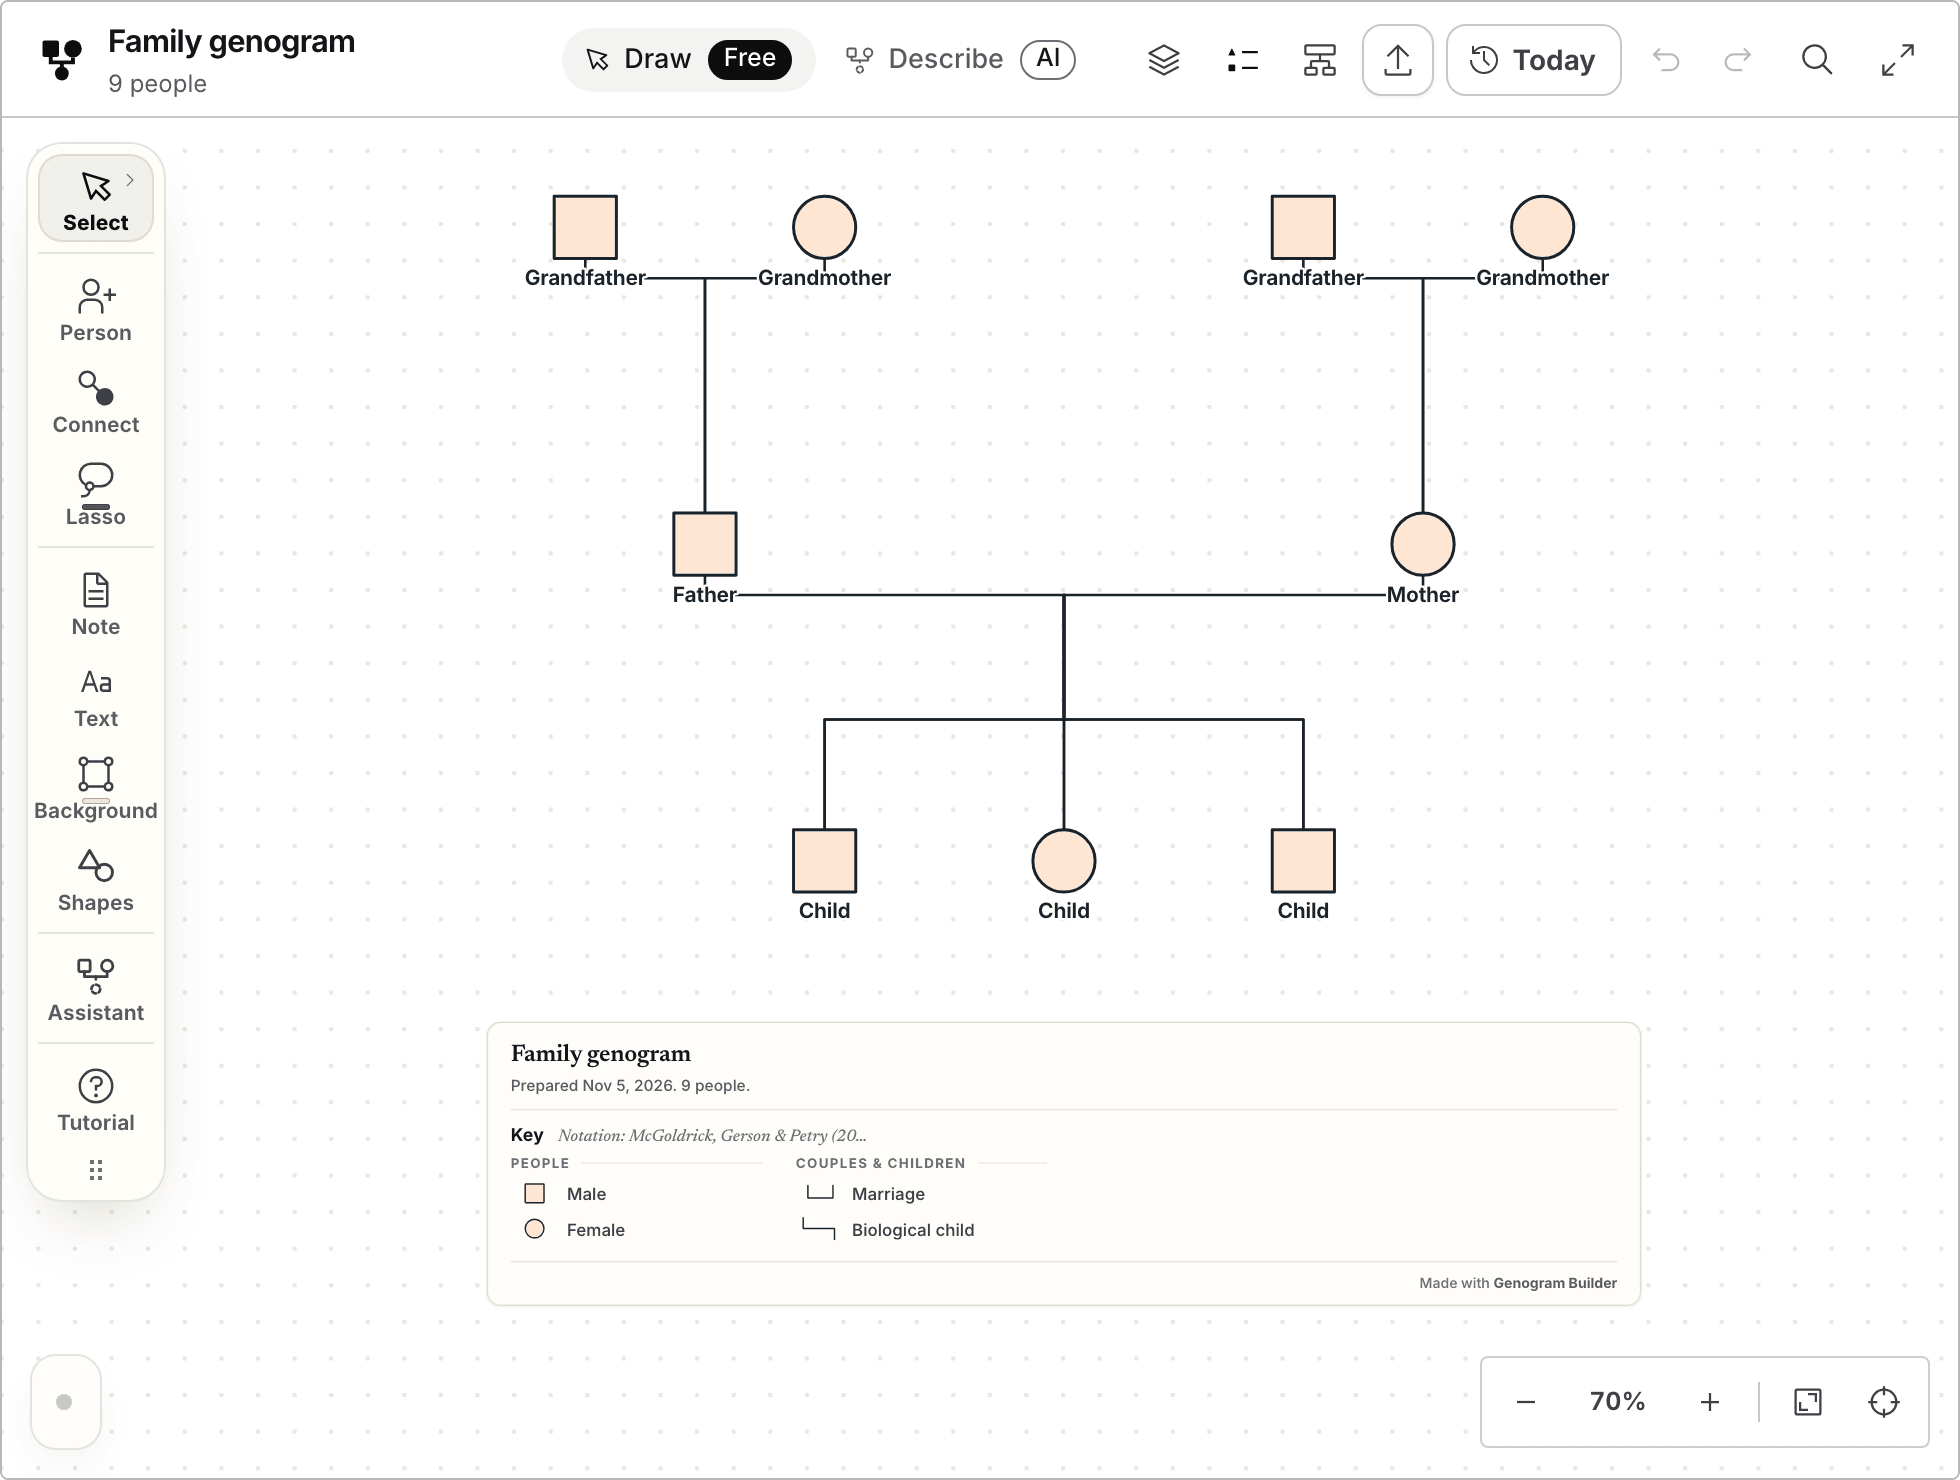
Genogram Builder
Draw the genogram here and place it on a slide
The editor lays out the symbols, the lines and the key, and a free account exports the chart as a PNG picture for PowerPoint.
- Opens without an account
- Symbols, lines and key drawn for you
- PNG and PDF with a free account, watermarked
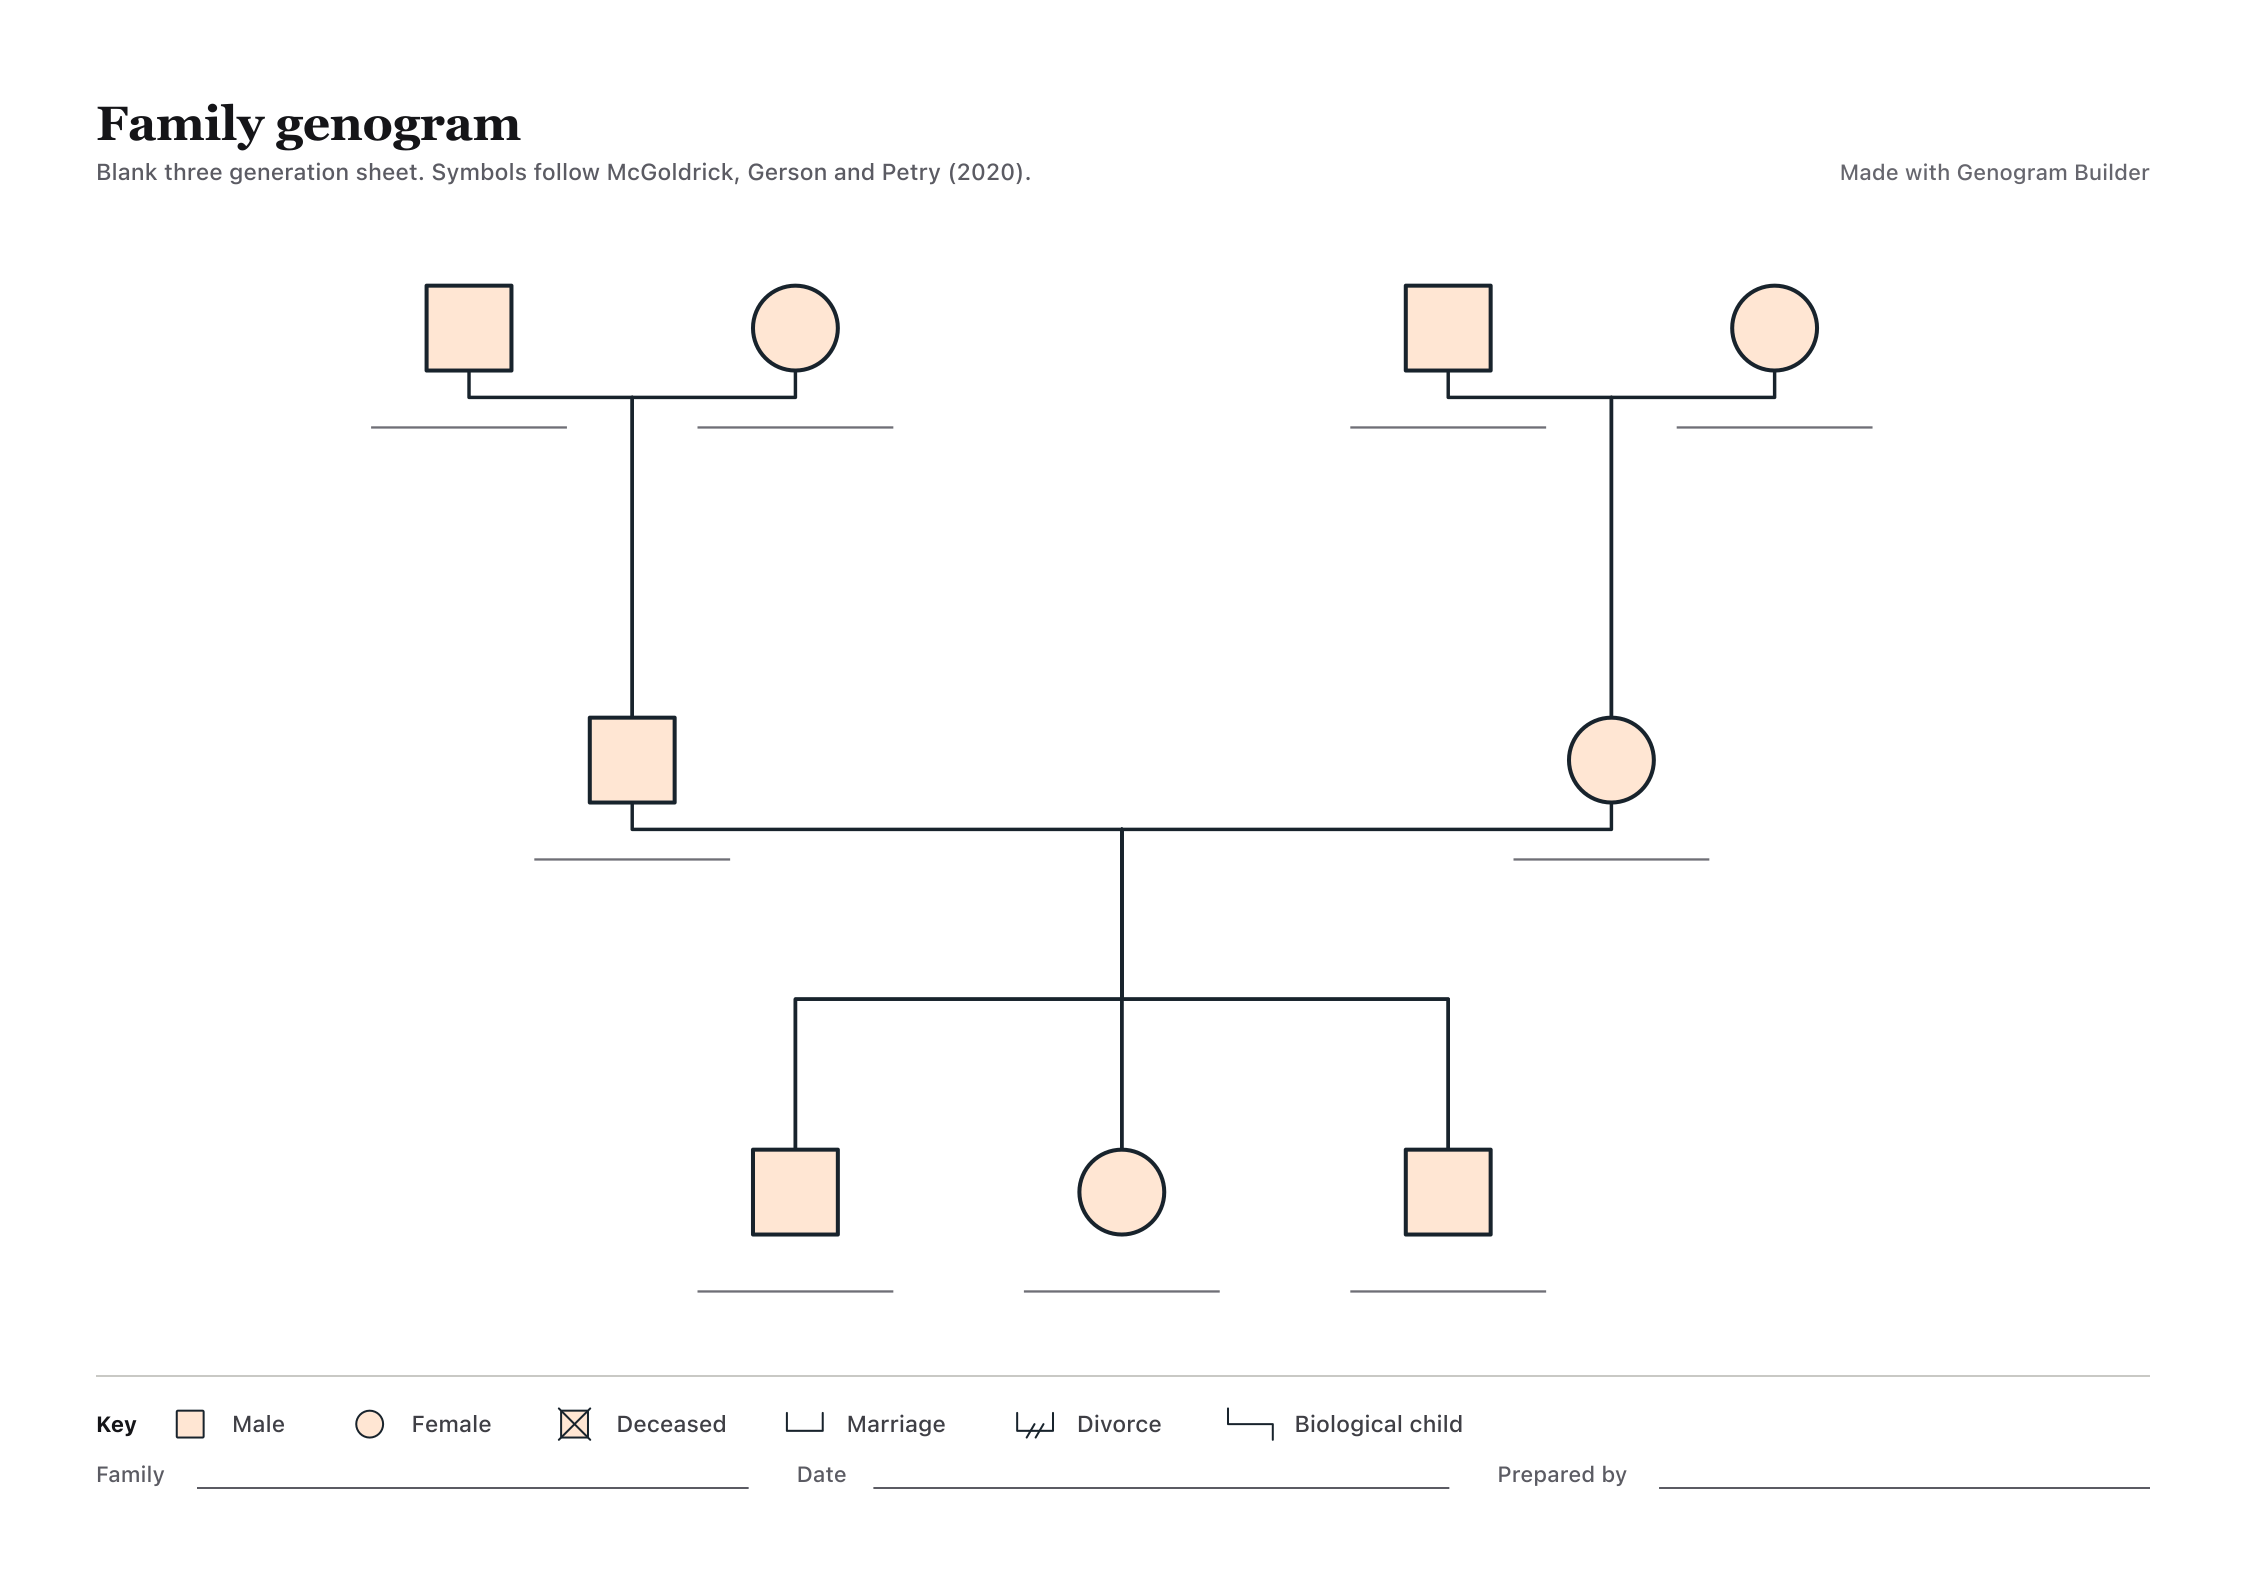
Connectors stay attached until you drag one of their ends
Microsoft offers straight, elbow and curved connectors under Lines. Dots on the outline of a shape show where a connector can attach, and Microsoft notes that the colour and style of these dots vary between versions of Office. Once both ends sit on dots, the connector stays attached and moves with the shapes, so a couple line follows a partner who is moved to make room for a child.
Moving either end of a connector detaches that end. If a couple line stops following a person, drag its end back onto a dot of that person. Curve, Freeform Shape and Scribble are not connectors, so a line drawn with them stays where it was drawn. The line down to the children starts from the middle of a couple line, where there is no dot, so check it whenever a parent moves.
Align and Group keep each generation on one level
A genogram is read in rows, so the people of one generation should sit on one level. Align Middle aligns the selected objects horizontally through their middles. With three or more people selected, Distribute Horizontally spaces them evenly. Align Selected Objects lines the people up with each other, and Align to Slide lines them up with the edges of the slide.
When the chart is finished, group every shape and line, so the family moves and resizes as one object. On a Mac, hold ⌘ while you click to select more than one object. To resize the group without stretching the symbols, hold Shift while you drag a corner handle.
Microsoft pages disagree about duplicating a shape on a Mac. One says to hold Option and drag, and the keyboard shortcut page gives Control+D. Copy and paste works on both systems if neither shortcut does.
SmartArt Hierarchy draws a family tree rather than a genogram
Microsoft says the Hierarchy type of SmartArt is perhaps most commonly used for a company organisation chart, and that it can also show decision trees, family trees or a family of products. It suits a plain line of descent.
A hierarchy places each box under one box above it. In a genogram a child descends from a couple, the two partners stand side by side on a couple line, and the marks for a death or a divorce sit on the symbols and the lines. Shapes and connectors draw all of these, which is why the steps above use them.
A genogram on a slide has to read from the back of the room
A slide is read at a distance and for a short time. Show three generations at most, and leave out the relatives who do not bear on the point of the slide. Make the names as large as the body text of the rest of the presentation, with the years on one short line under each name.
Put a key on the same slide with only the symbols and lines that the chart uses. To show a pattern in stages, finish the family first, then copy the slide and add the relationship lines on the copy, so the audience sees who is in the family before they see how the people relate.
The editor exports a picture you can place on a slide
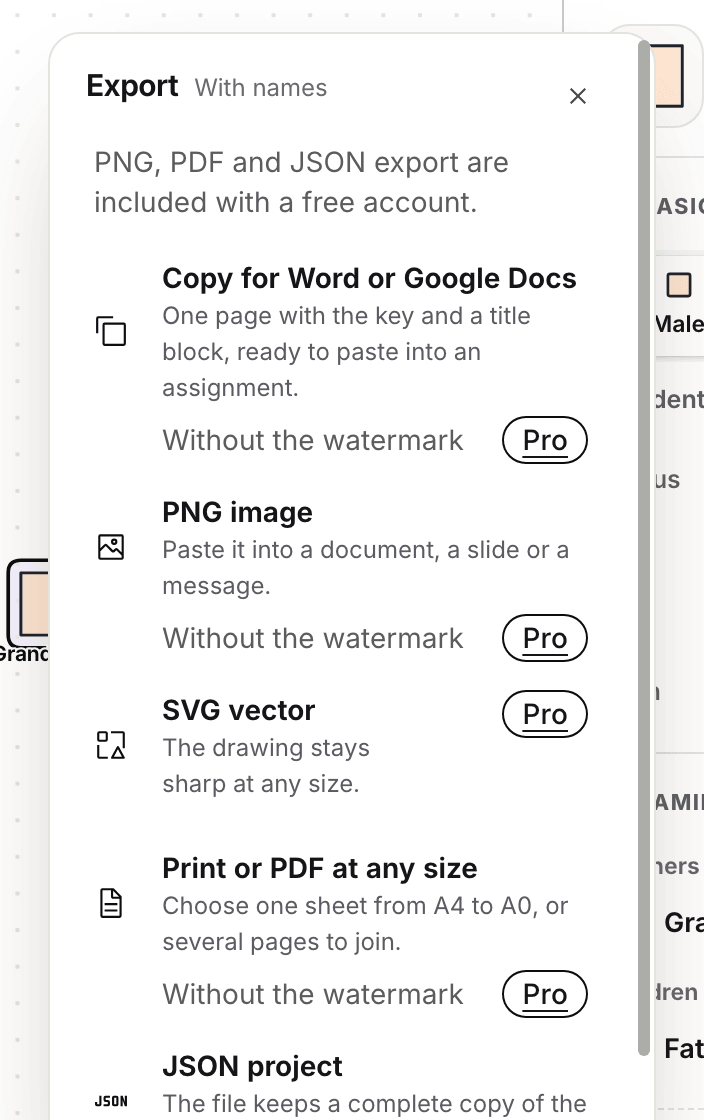
In Genogram Builder each new person is placed in free space on the right row, Arrange tidies the rows when you ask it to, and the finished family leaves the editor as one picture, ready for the slide. Drawing needs no account. Exporting needs a free account, and the picture carries the Genogram Builder watermark unless you have Pro or Max.
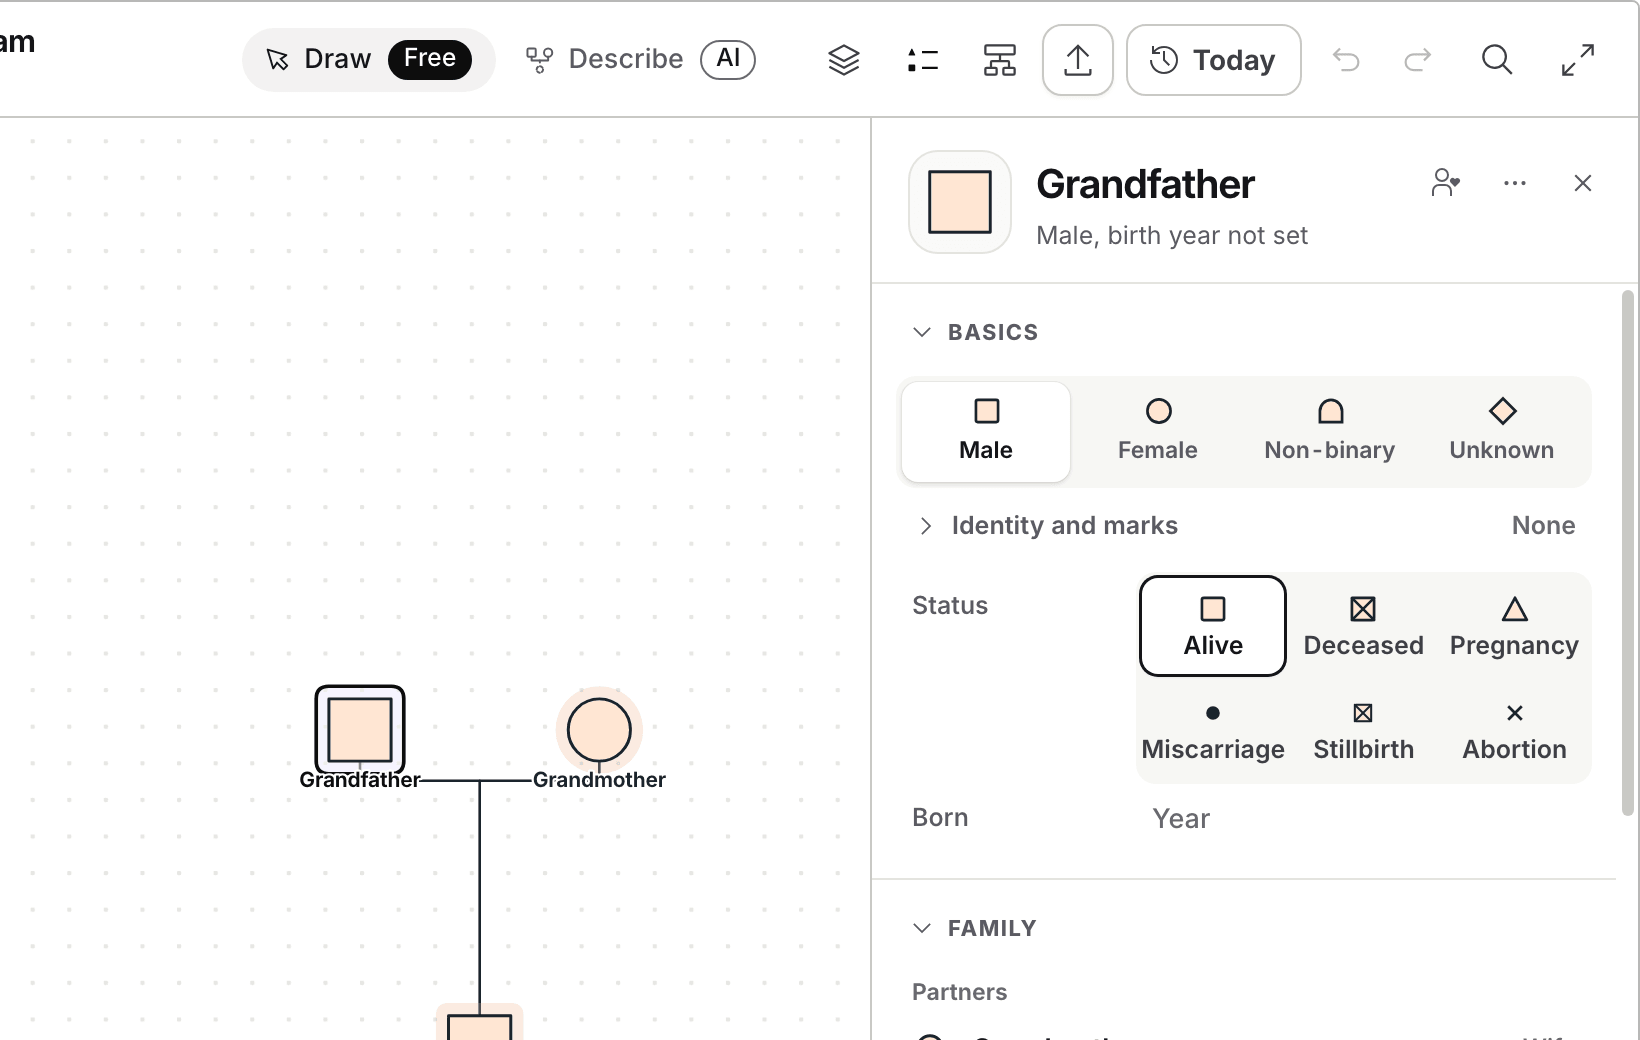
Open the blank three generation chart and select a person. Type the name at the top of the panel that opens, then set the status and the year of birth.
Open Export and choose PNG image, which the menu describes as a picture to paste into a document, a slide or a message.
Paste or insert the picture on the slide. Hold Shift while you drag a corner handle, so the chart keeps its proportions as it grows.
Common questions
Whether this site has a PowerPoint file to download
There is no PPTX file here. The blank three generation sheet downloads as a PNG picture to place on a slide, and the three generation template opens the same family in the editor.
How to show a death or a divorce on a slide
Draw an X across the symbol of a person who has died with two straight lines, and two short slashes across the couple line of a divorced couple. The guide to genogram symbols shows each mark.
Choosing between Google Docs and PowerPoint
Use PowerPoint when the chart is shown to a room and Google Docs when it is part of a written document. The Google Docs guide covers the drawing tool there.
Sources and methodology
We make Genogram Builder. We used the references below for this guide. Last checked on 5 November 2026.
- Microsoft Support, draw or delete a line or connector
- Microsoft Support, align objects on a slide
- Microsoft Support, group or ungroup shapes, pictures or other objects
- Microsoft Support, change the size of a picture, shape, text box or WordArt
- Microsoft Support, add shapes
- Microsoft Support, keyboard shortcuts to create PowerPoint presentations
- Microsoft Support, choose a SmartArt graphic
Type the names into the blank three generation template, then export the chart as a PNG for your slide with a free account.
Start from the blank template