How to make a genogram in Google Docs in seven steps
Learning how to make a genogram in Google Docs starts with a plan on paper, because the chart is built from plain shapes and lines in the drawing editor. Write each generation as a row, oldest at the top, and note which children belong to which couple. The menu names below are written as the Google help pages write them.
- Open a new drawing
In the document, choose Insert, then Drawing, then New. The drawing editor opens with its own toolbar.
- Draw one person
Choose Shape, pick a rectangle for a man or an oval for a woman, and drag it out as a square or a circle. Make it the size every other person will be.
- Copy the symbol for everyone else
Hold Option on a Mac or Ctrl on Windows while you drag a shape, and a copy is made. Place the copies in rows, one row for each generation.
- Name each person
Double-click a shape and type inside it, or choose Text Box and click under the symbol to add the name and the year of birth.
- Join each couple
Open the line tool and choose Elbow Connector. Draw from one partner to the other so that the line ends on both shapes.
- Hang the children from the couple
Draw a short line down from the middle of the couple line, a sibling line across, and a line from it to each child, oldest on the left.
- Close the drawing
Press Shift+Esc on Windows or ⌘+Esc on a Mac to close the drawing editor and return to the document.
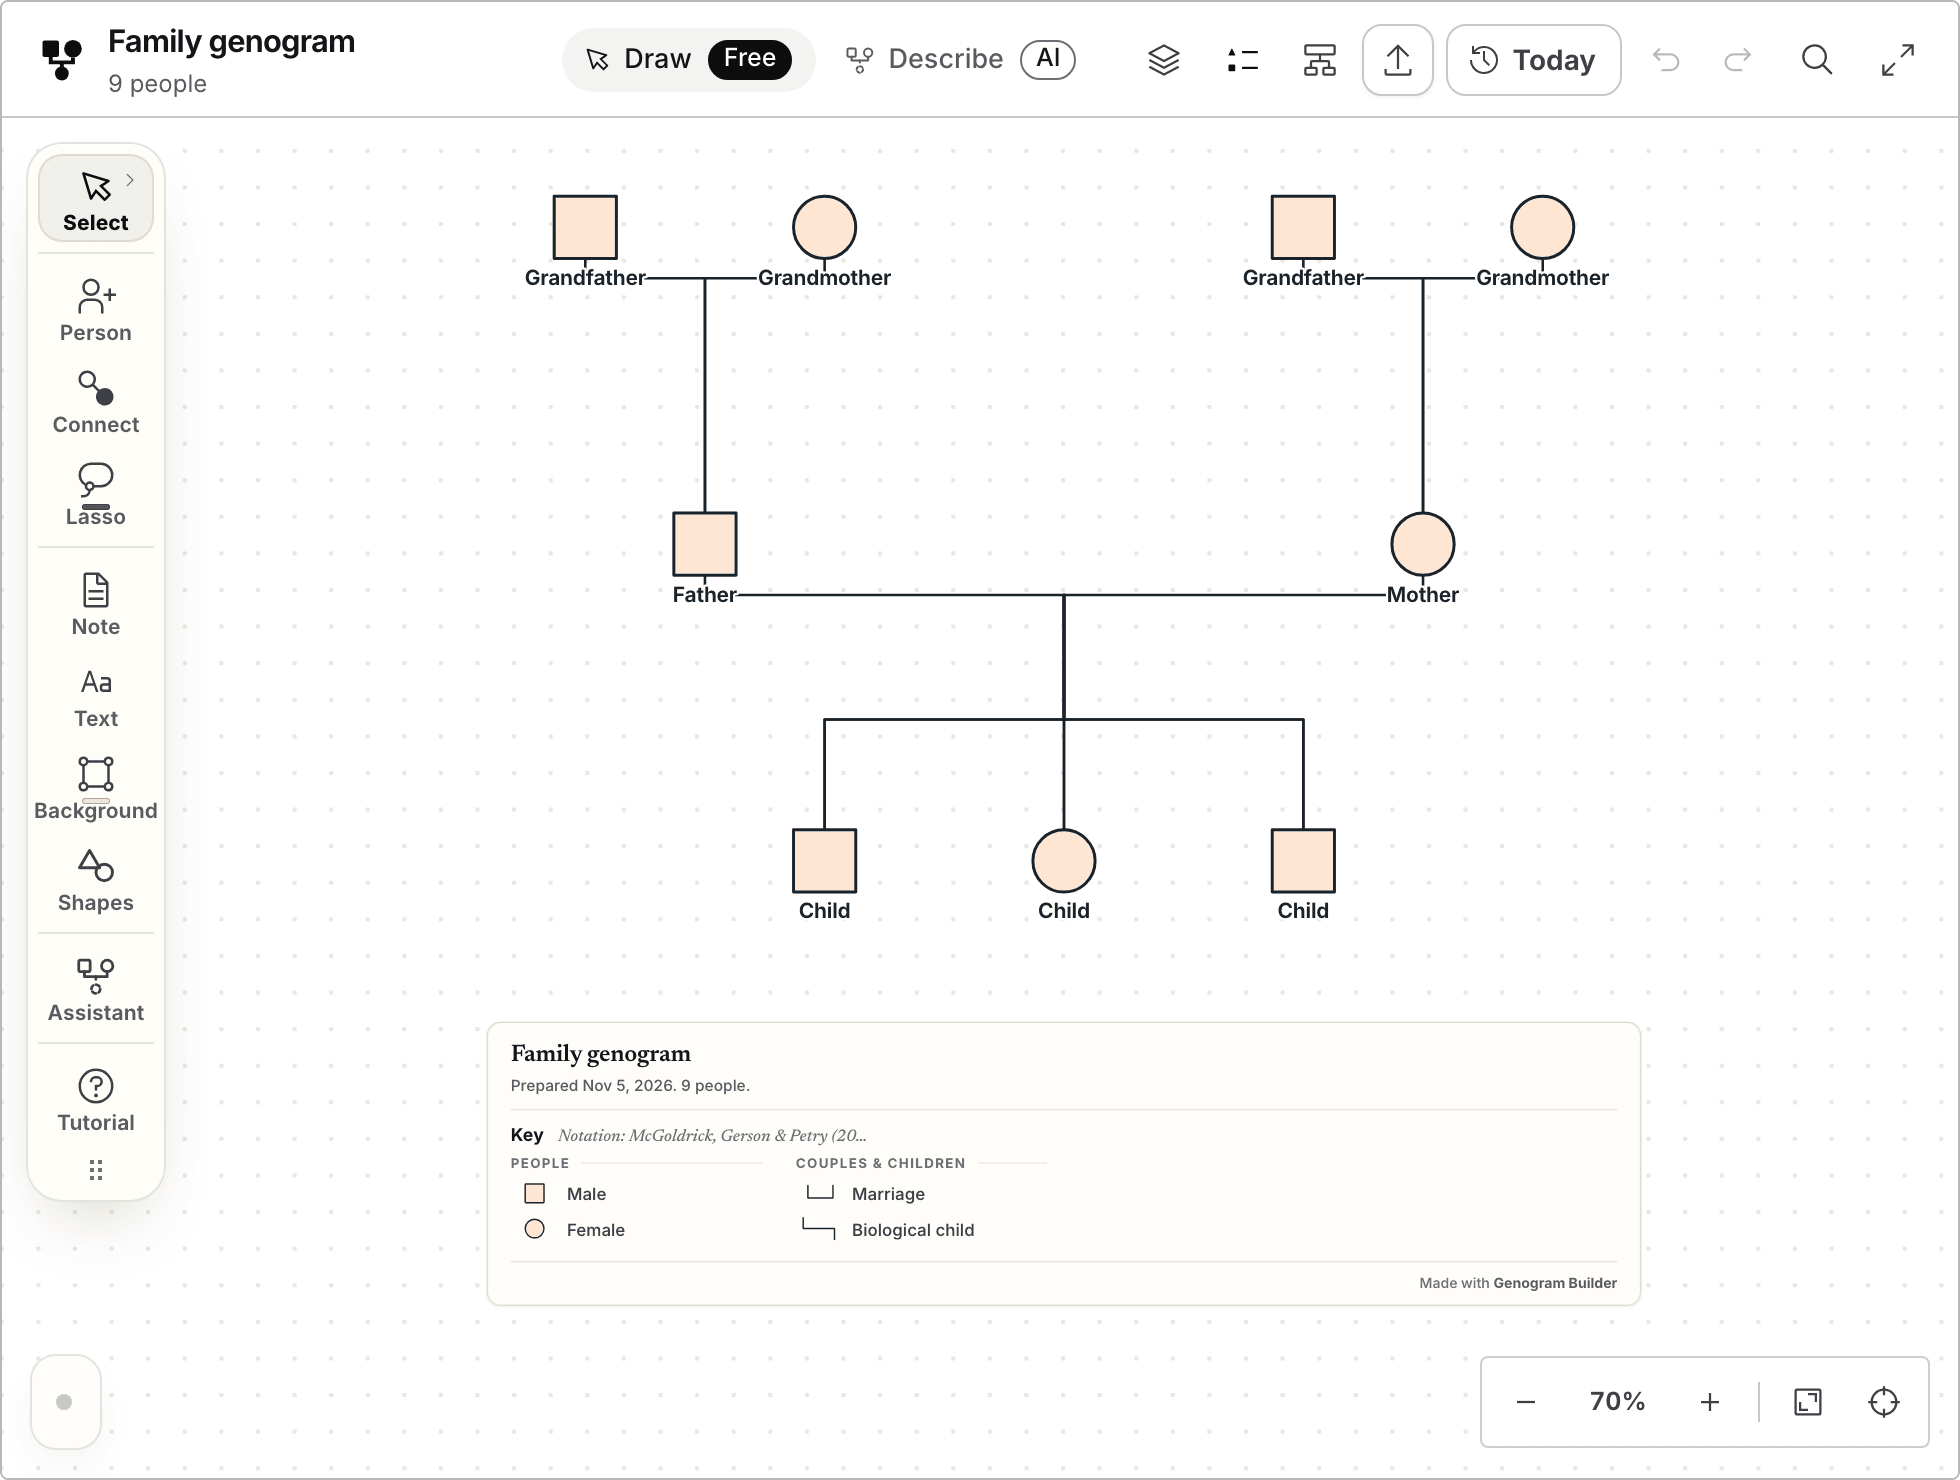
Genogram Builder
Draw the genogram here and paste it into Docs
The editor draws the symbols, the couple lines and the key, and a free account copies the finished chart as one picture for your document.
- Opens without an account
- Symbols, lines and key drawn for you
- PNG and PDF with a free account, watermarked
A small three generation family makes a clear first drawing
The example is a fictional family of six. Ruth and Alan are the grandparents on the top row. Their daughter Clare is in the middle row with her husband Tom. Their children, Ben and Lucy, are on the bottom row, with Ben on the left because he is the older.
Draw the men as squares and the women as circles, and put the husband on the left of each couple, as the standard notation does. Write the year of birth above each symbol and the name under it. If Alan has died, draw an X across his square with two plain lines and write the year of death beside the year of birth. If Clare and Tom divorced, draw two short slashes across their couple line. The guide to genogram symbols shows each of these marks.
Trace each child upward when the drawing is done. Ben and Lucy should lead to the line between Clare and Tom, and Clare to the line between Ruth and Alan.
Connector lines keep the chart together when people move
The line tool of a Google drawing offers seven kinds of line. They are Line, Elbow Connector, Curved Connector, Arrow, Curve, Polyline and Scribble. The Elbow Connector draws the right angles that a couple line and a child line need, and it is the line to use for the structure of the family.
Google described connectors on its Drive blog in December 2010. A new line can connect directly to a shape, small red dots mark the points it can connect to, and the lines attached to a shape stretch to stay connected however far the shape is moved or turned. Draw each couple line from a red dot on one partner to a red dot on the other, and the couple stays joined when you make room for a new child.
The line down to the children starts from the middle of a couple line rather than from a shape, so check it after moving either parent. For a hostile relationship, which the notation draws as a zigzag, Polyline draws one click at each bend and finishes with a double-click.
Place the drawing where your reader expects it
A genogram in an assignment reads best on a page of its own, with a figure number, a short caption and the key beside it.
Google documents five layout options for an image, which are In line, Wrap text, Break text, Behind text and In front of text, and says they are not available in a pageless document.
The Word guide covers the same task in Microsoft Word, where the drawing tools have different names, and the PowerPoint guide covers a genogram for a slide.
The editor draws the genogram and Docs receives a picture
A hand drawing has to be redrawn when the family changes. In Genogram Builder each new person is placed in free space on the right row, Arrange tidies the rows when you ask it to, and the finished chart goes into Google Docs as one picture. Drawing needs no account. Copying or downloading needs a free account, and the picture carries the Genogram Builder watermark unless you have Pro or Max.
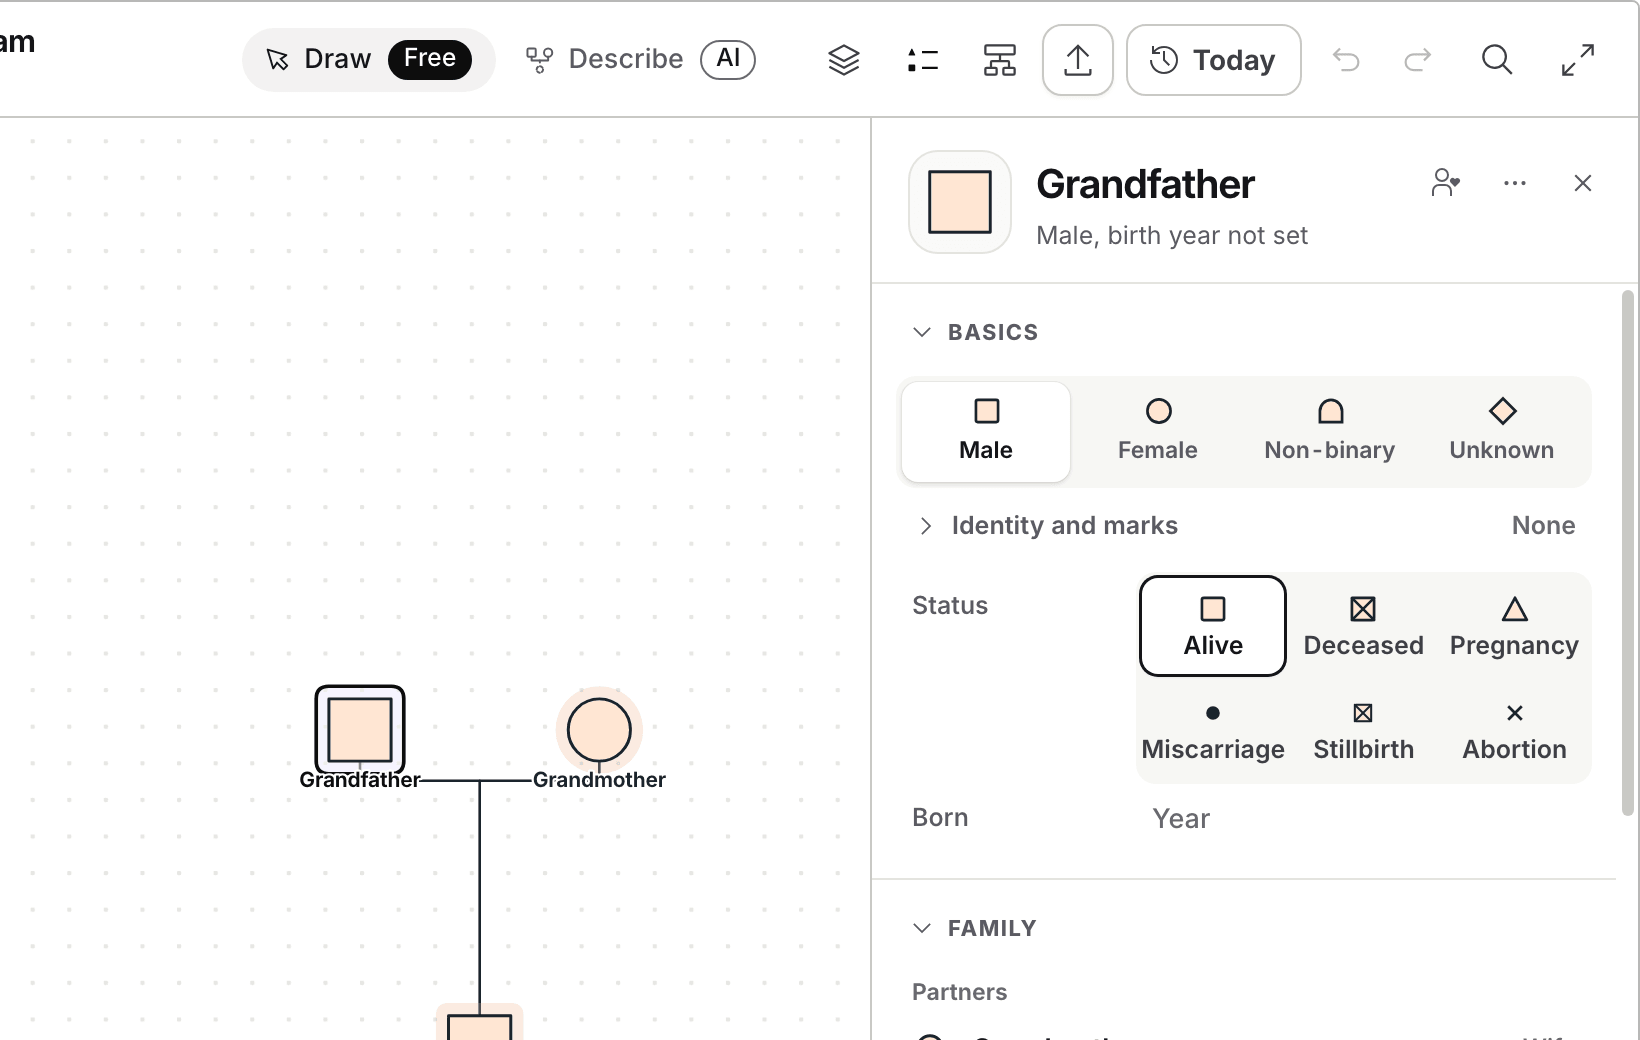
Open the blank three generation chart and select a person. Type the name at the top of the panel that opens, then set the status and the year of birth.
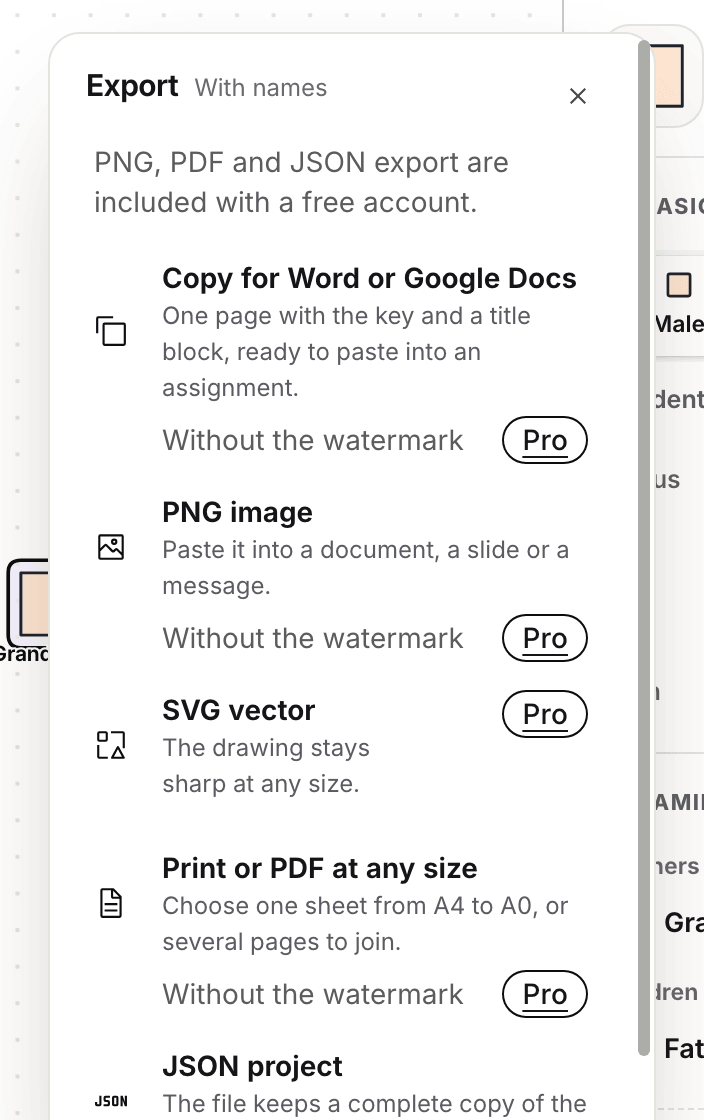
Open Export and choose Copy for Word or Google Docs. In the preview, choose US Letter or A4 and the orientation, keep or turn off the title block and the key, and choose Copy page.
In the Google document, place the cursor where the chart belongs and paste with Ctrl+V on Windows or ⌘+V on a Mac. If your browser blocks the copy, download the PNG instead.
Common questions
Whether a pasted chart can be edited in Docs
Not person by person. Google Docs receives the chart from the editor as one picture, which you can resize and caption. To change a person or a line, change the chart in the editor and paste the new picture in place of the old one.
Where to find a blank sheet to fill in by hand
The three generation template has a blank sheet as a PDF to print and as a PNG picture, with a name line under every symbol and the key at the foot of the page.
Sources and methodology
We make Genogram Builder. We used the references below for this guide. Last checked on 5 November 2026.
Type the names into the blank three generation template, then copy the chart into your Google document with a free account.
Start from the blank template