Bowen drew a family diagram, and the genogram grew from it
Murray Bowen lived from 1913 to 1990. He studied families at the Menninger Clinic, then at the National Institute of Mental Health, and from 1959 at Georgetown University. The Georgetown University Family Center was founded in 1975, became an independent nonprofit in 1990 and is known today as the Bowen Center.
Bowen used what he called a family diagram. The Bowen Center describes it as “a graphic depiction of facts of functioning over several generations” and as a tool for seeing the family as an emotional system. It also notes that several students of Bowen theory adapted the family diagram into what is commonly called a genogram, and it points to an article by John F. Butler, published in 2008, on how the two differ.
A Bowen genogram therefore starts from facts, such as who was born, married and died and when, then adds the emotional relationships the family describes. The theory supplies the questions a reader brings to them. A genogram in general can record a medical history without any of this theory.
Genogram Builder
A family to read with Bowen theory
Eleven fictional people over three generations, with a cutoff, a fused couple, hostile siblings and four conditions in colour.
- Opens without an account
- Every line, date and condition can be changed
- PNG and PDF export with a free account
The eight concepts of Bowen theory each leave a trace on a chart
The Bowen Center lists eight concepts. The middle column summarises how the Center describes each. The right column is our guide to where a reader of a Bowen genogram might look, and a pattern there is a reason to ask the family, not a finding about them.
| Concept | What it describes | Where to look on a genogram |
|---|---|---|
| Triangles | A three-person relationship, the smallest stable unit, in which tension moves around the sides | Two people close and both at odds with a third, or a child between two parents |
| Differentiation of self | How far a person stays thoughtful and principled under pressure from the group | There is no symbol for it. Read it in the notes and in who keeps contact with whom |
| Nuclear family emotional process | Four patterns of where tension lands, namely marital conflict, dysfunction in one spouse, impairment of a child and emotional distance | Conflict or distance between partners, a condition in one, or a symptom in a child |
| Family projection process | Parents pass an anxiety to a child by focusing on the child and treating the problem as real | A focused-on line from a parent to a child, and a symptom in that child |
| Multigenerational transmission process | Small differences in differentiation between parents and their children that build over many generations into marked differences among members of the family | The same condition, role or relationship down one line of descent |
| Emotional cutoff | Unresolved issues managed by reducing or ending contact, so they go quiet without being resolved | A cutoff line, with the year contact ended |
| Sibling position | People in the same birth position tend to share traits, building on the research of Walter Toman | The years of birth of the children, and their order from left to right where the chart keeps it |
| Societal emotional process | The same emotional process at work in a whole society, through regression and progression | Events outside the family in the same years, such as a war or a migration |
Read one fictional family with the eight concepts in mind
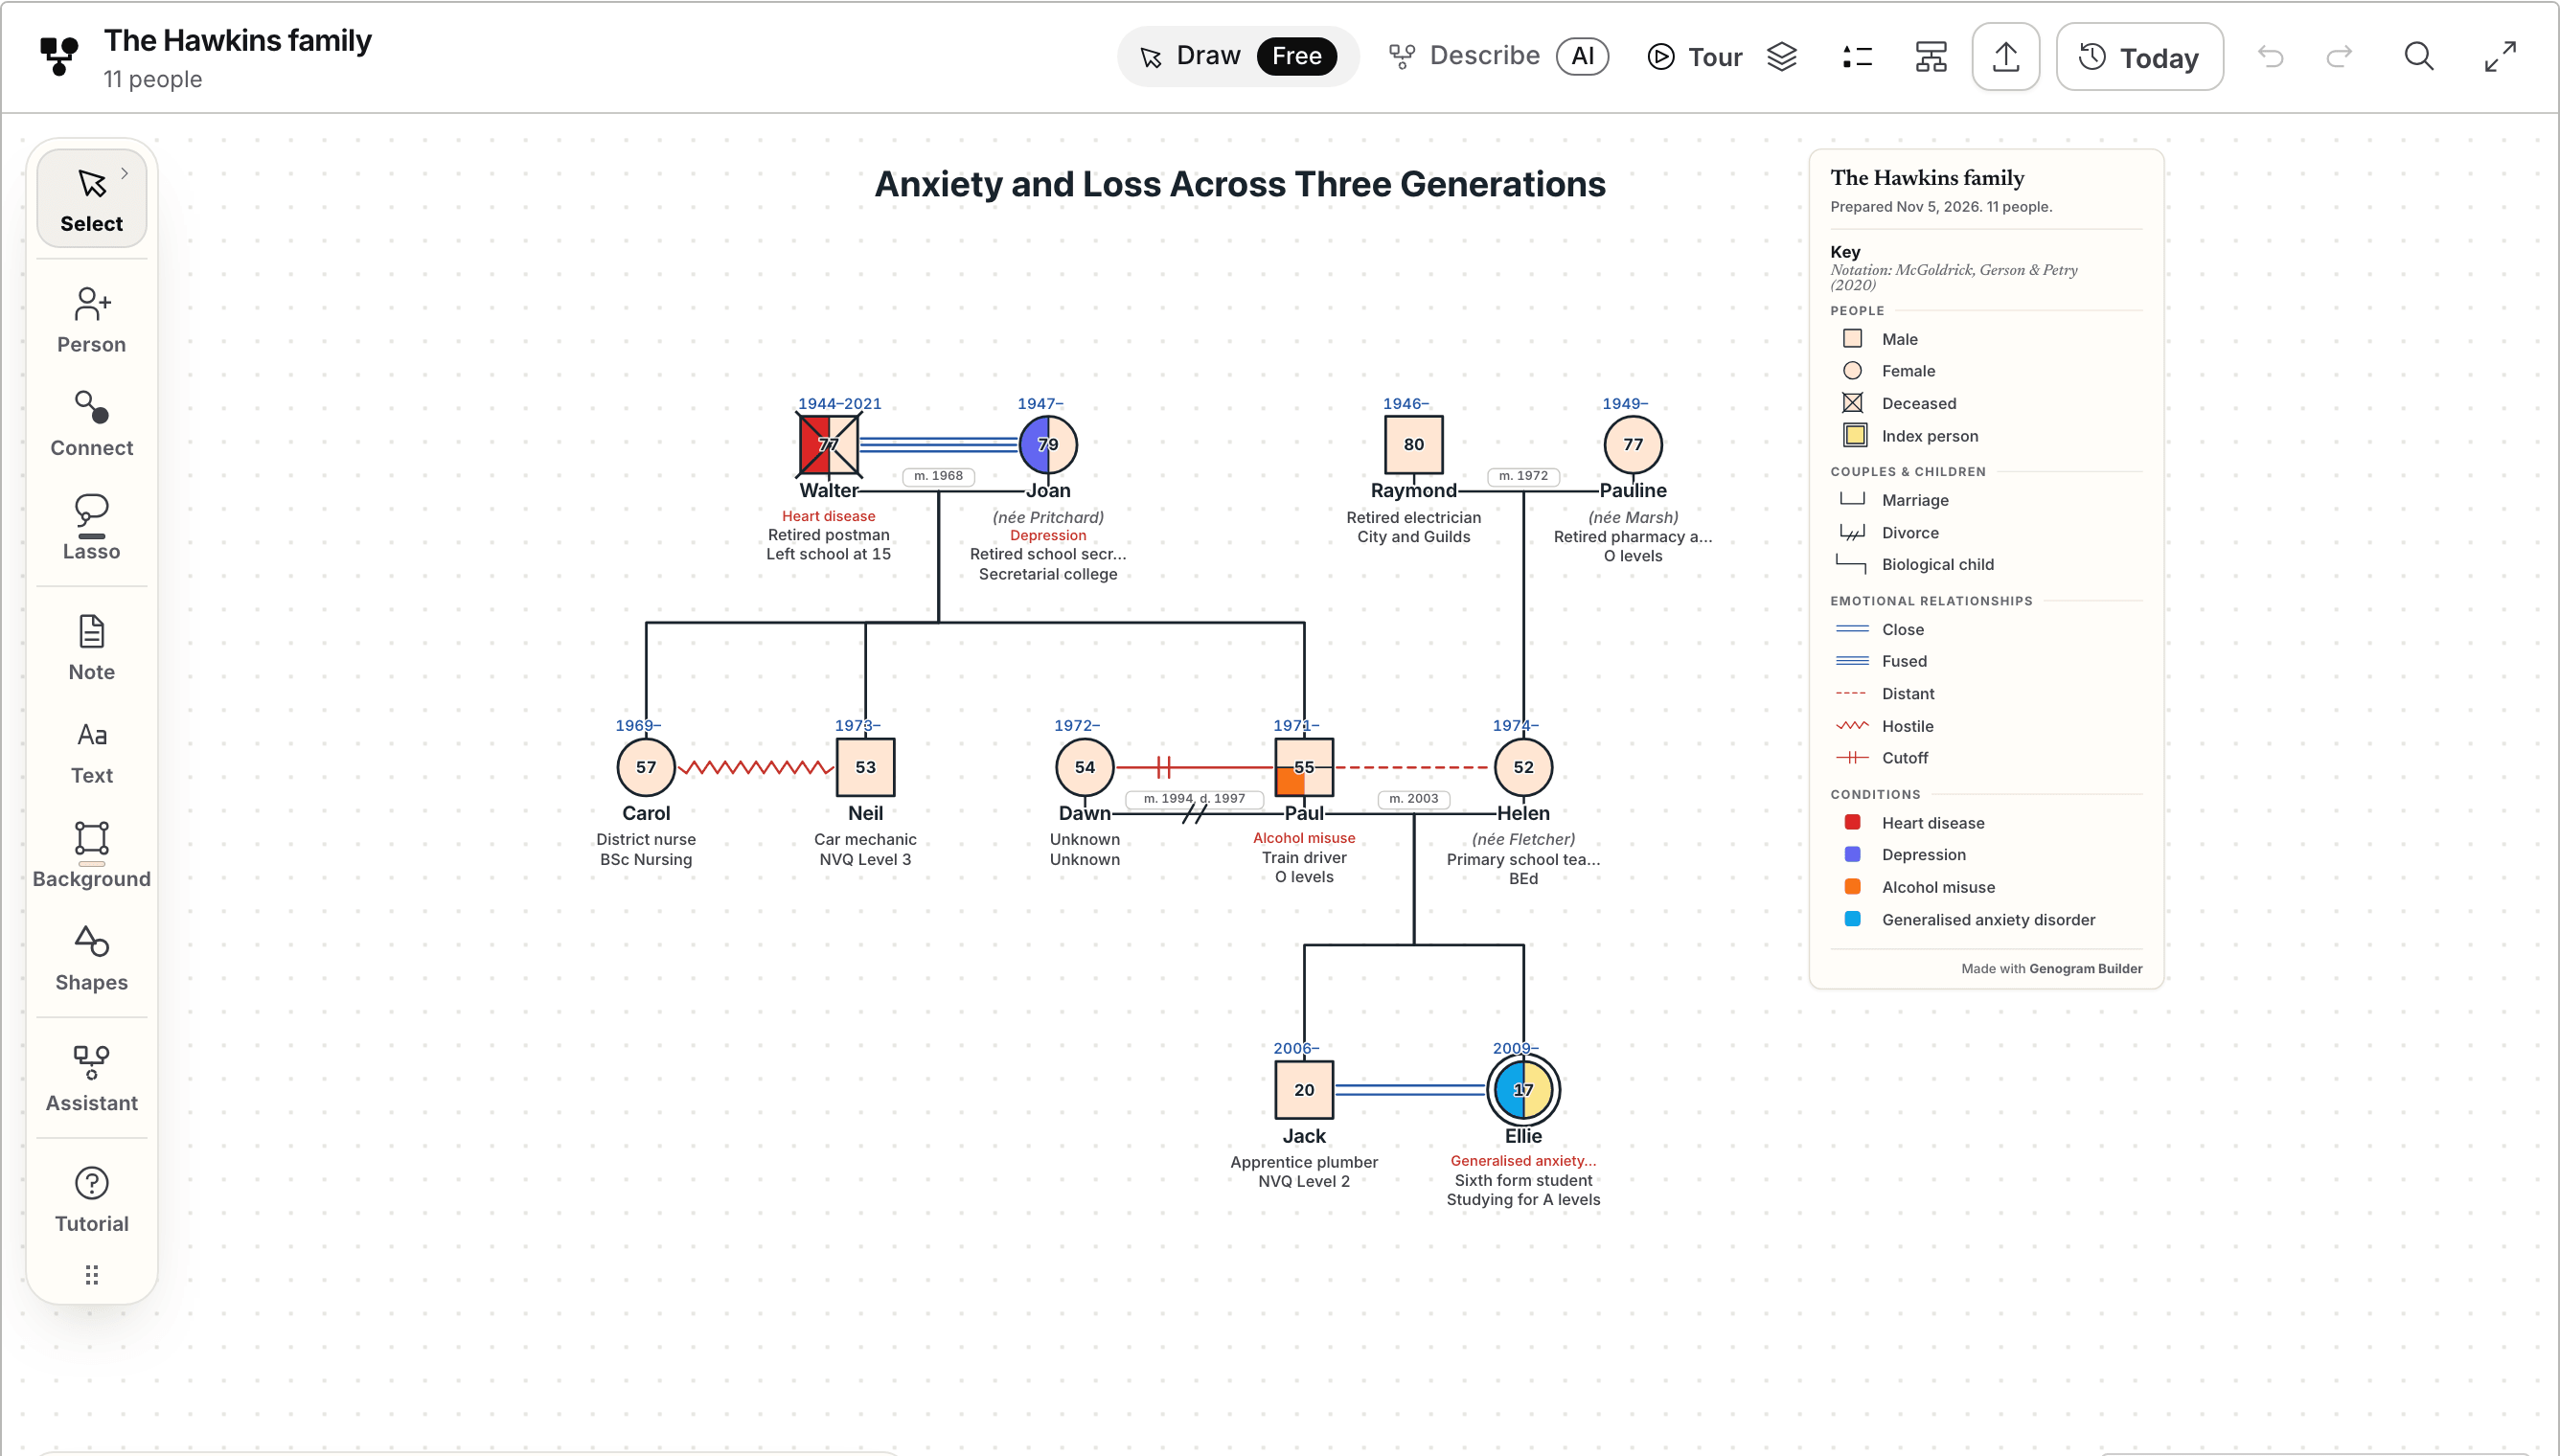
The Hawkins family is fictional and comes from the template library. Walter Hawkins, born in 1944, married Joan Pritchard in 1968, and the chart draws them as fused. Walter had heart disease and died in 2021, and Joan has had depression since his death. Of their three children, Carol and Neil are joined by a hostile line over who cares for their mother.
Their son Paul, born in 1971, is the middle child, drawn to the right of his siblings so that his two marriages sit beside him. He married Dawn Reilly in 1994 and divorced her in 1997, and the two have been cut off since. Paul married Helen Fletcher in 2003, and the chart draws them as distant. Paul misused alcohol for many years and has been in recovery since 2019. Their daughter Ellie, born in 2009, is the person the genogram is about. She has generalised anxiety disorder and has not attended school since March 2026. Her brother Jack, born in 2006, is close to her.
Read as a Bowen genogram, the chart shows an emotional cutoff between Paul and Dawn, distance in the marriage of Paul and Helen, and conflict between two siblings over a parent, where a triangle with Joan could be explored. Anxiety in the third generation, under a parent in recovery and a grandmother with depression, invites questions about multigenerational transmission. These are questions for the family. The chart cannot show that one event caused another.
Read a Bowen genogram in the same order each time
A fixed order keeps the facts apart from the interpretation and makes two charts comparable.
- Check the facts first
Names, years, marriages, divorces and the order of the children, generation by generation.
- Mark the cutoffs and the fusions
Note where contact ended and where two people are drawn as fused, with the years.
- Look for triangles
Find two people close to each other and in conflict with a third, especially around the person the chart is about.
- Follow one symptom down the generations
Trace a condition, a role or a kind of relationship along one line of descent.
- Set events beside the dates
A death, a move or a lost job in the same years as a change in the family is worth a question.
The chart records facts and the reader does the interpreting
Genogram Builder draws the people, the lines and the conditions you enter, and it does not apply Bowen theory to the family for you. The fused, distant, hostile and cutoff lines are part of the notation the editor uses, and the genogram symbols guide shows each one. The interpretation belongs to the person who knows the family and the theory, as it does in family therapy.
A visitor can open and change the Hawkins family without an account but cannot export. A free account exports a PNG or a PDF with a watermark, or a JSON project, and Pro removes the watermark.
Common questions
Whether a Bowen genogram is the same as a family diagram
Not exactly. The Bowen Center calls its own form a family diagram and says that students of the theory adapted it into the genogram. The two share the generations and the facts.
Which symbols a Bowen genogram uses
This guide and the editor use the notation of McGoldrick, Gerson and Petry, published in 2020, which includes fused, distant, hostile and cutoff lines. If a course asks for another convention, follow it and say so in the key.
How many generations to draw
At least three, since the family diagram records facts of functioning over several generations. Add a fourth when a pattern you want to follow reaches further back.
Whether the editor applies Bowen theory
No. It draws what you enter and keeps the key. Reading the chart through Bowen theory is the work of the person who drew it, ideally with the family.
Sources and methodology
We make Genogram Builder. We used the references below for this guide. Last checked on 5 November 2026.
Read the fictional family in the editor, then change a line or a date and see how the picture shifts. No account is needed.
Open the Hawkins family